Advertisement
On the Radar – Coins to Watch 11/04

- Bitcoin shows hot and cold signals. What comes next, higher or lower?
- US economic data could provide the kick we need to pick a direction.
- Altcoin Analysis – KAS, THETA.
Bitcoin had a strong start to the week, but it has experienced a 7% drop since Monday. Although it has mostly recovered from this dip, the market appears to be at a crucial technical turning point, which I will explain in detail below.
Most altcoins may remain range-bound until Bitcoin decides where to go next.
This is where we can turn to the general underlying conditions for some potential hints on where things could go – such as the latest round of inflation data.
Inflation still hot
Last night’s US Consumer Price Index (CPI) data showed that inflation is still present in recent economic figures. Even though this data might lag, it still impacts sentiment towards the roadmap to lower interest rates. This is based on the idea that lower-cost money increases available funds for investments, such as cryptocurrencies.
Importantly, we still have more pieces of the puzzle for this month. Tonight, we have US Producer Price Index (PPI) data, which measures the cost of producing goods that will then be consumed. In two weeks, we will have US Gross Domestic Product (GDP) data, which broadly reflects economic growth.
In my opinion, whether PPI data meets or falls below expectations could lead to favourable GDP figures later in the month. Last month, we saw a lower-than-expected figure for this metric which could suggest that producers’ costs are generally trending down.
Let’s see what happens!
Related: Arthur Hayes Warns Bitcoin May “Slump” Post Halving, Plans Trading Hiatus Until May
Bitcoin – BTC
Looking at some very simple range analysis using last week’s high and low, below are my thoughts heading into the end of the week.
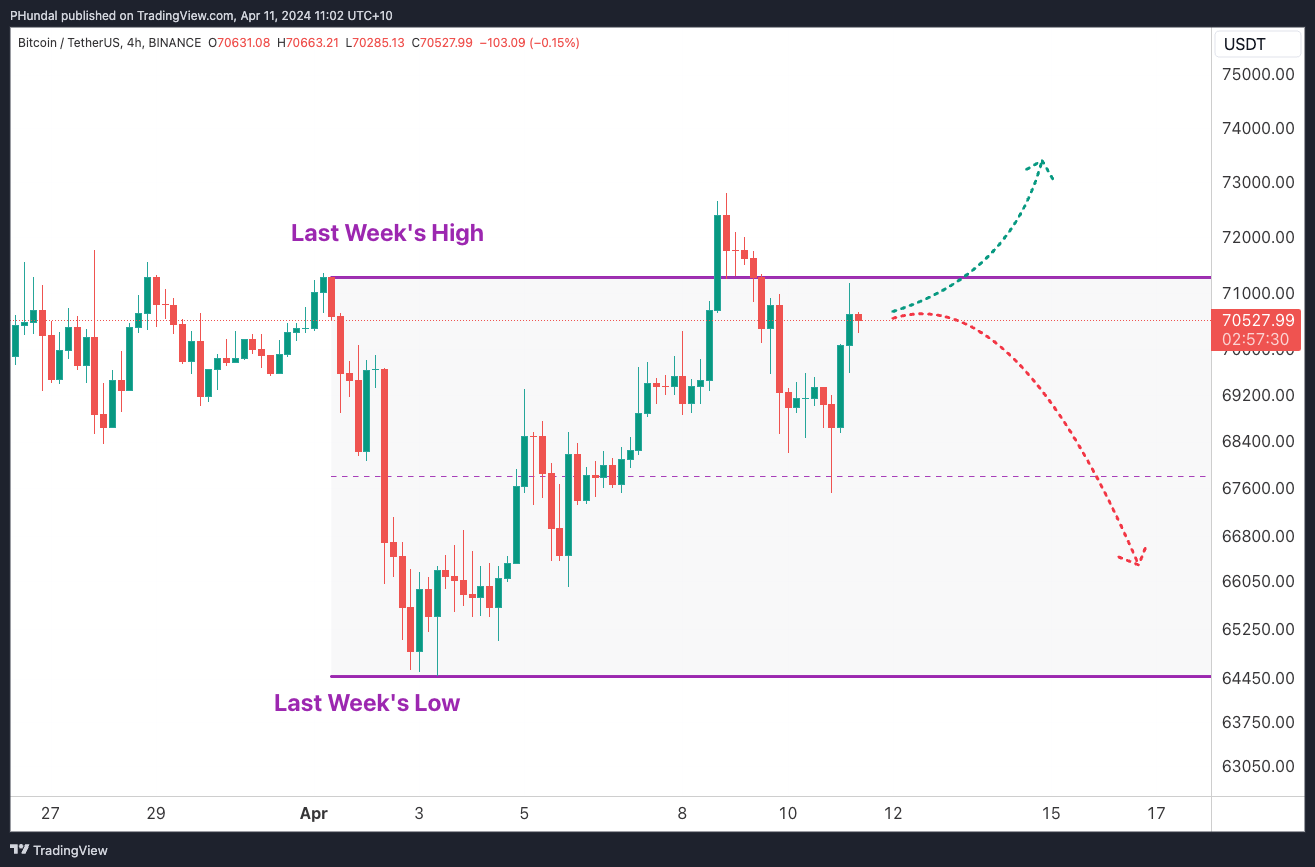
Bitcoin is trading just above the mid-point of the previous week, but I am waiting to see more conviction from the bulls or bears here. The major news releases mentioned earlier might influence the overall market trend.
Advertisement
Bullish scenario
Starting to break above the previous week’s high and holding could precipitate a breakout heading into next week’s trading, which could develop the next uptrend.
Bearish scenario
Retesting the previous week’s high, we could also see an absence of buyer interest, resulting in more sideways and down. I would look at the low in the previous week as an area of interest.
Kaspa – KAS
A newer layer-1 blockchain, which was a regular top performer in 2023 and has a thriving community. Let’s look at how KAS is shaping up.
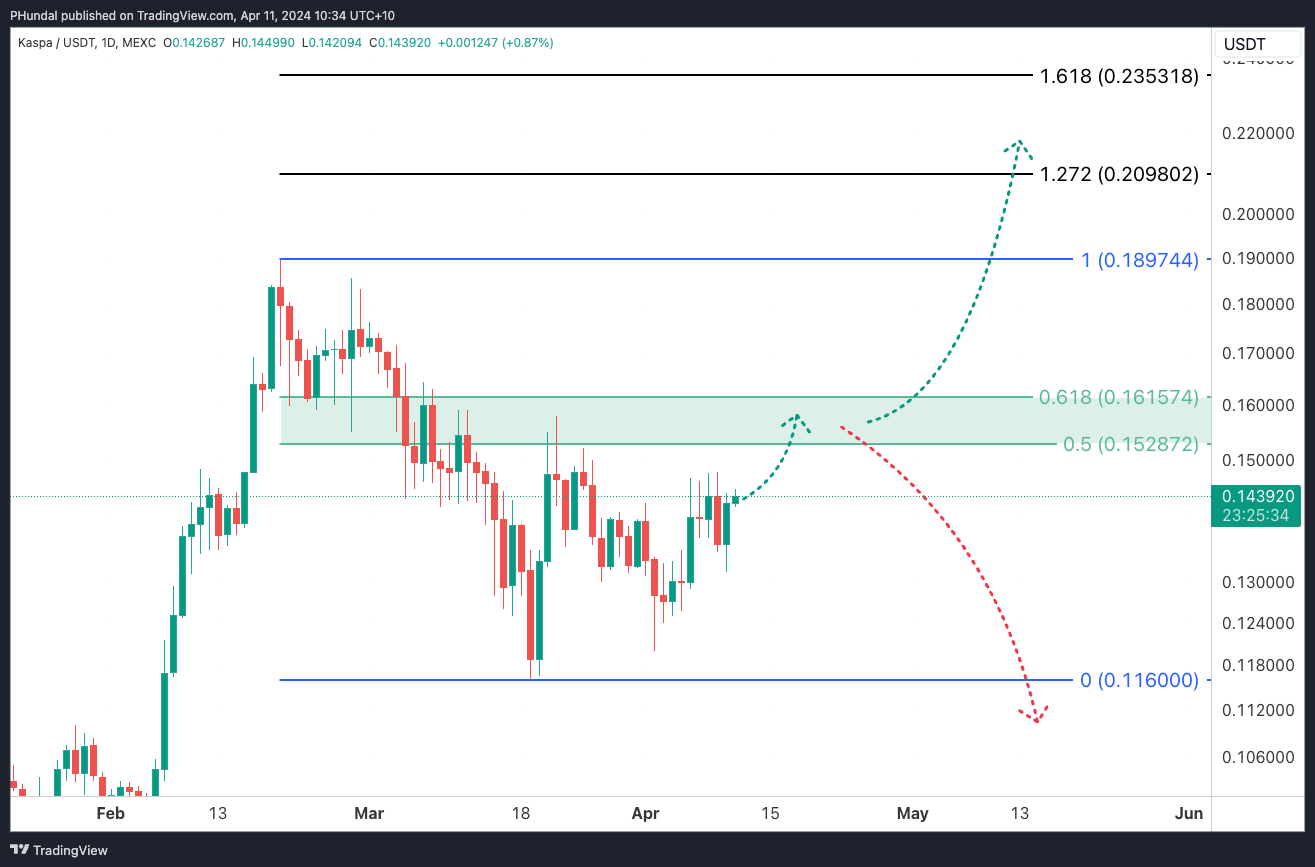
Using a Fibonacci tool, we can measure from the most recent swing high and low. A key sign of strength when using Fibonacci is getting above the 0.618 ratio and seeing the market push higher. I’ve identified this as the green-boxed zone above.
Bullish scenario
KAS gets over $0.1615 (the 0.618 ratio) and holds. Next targets are the previous range high ($0.189), the 1.272 ratio ($0.209) and the 1.618 ratio ($0.235)
Bearish scenario
Failure to find buyers to drive prices past this midpoint and 0.618 ratio, resulting in a new low under $0.116.
Related: Analyst Identifies Must-Buy Altcoins Pre-Bitcoin Halving, Predicts Explosive Narrative Shift
Theta Network – THETA
THETA has experienced a strong resurgence in the last few months, as the project has pivoted to AI cloud infrastructure from cloud media storage. So far, the market has responded positively to the team’s strategic shift.
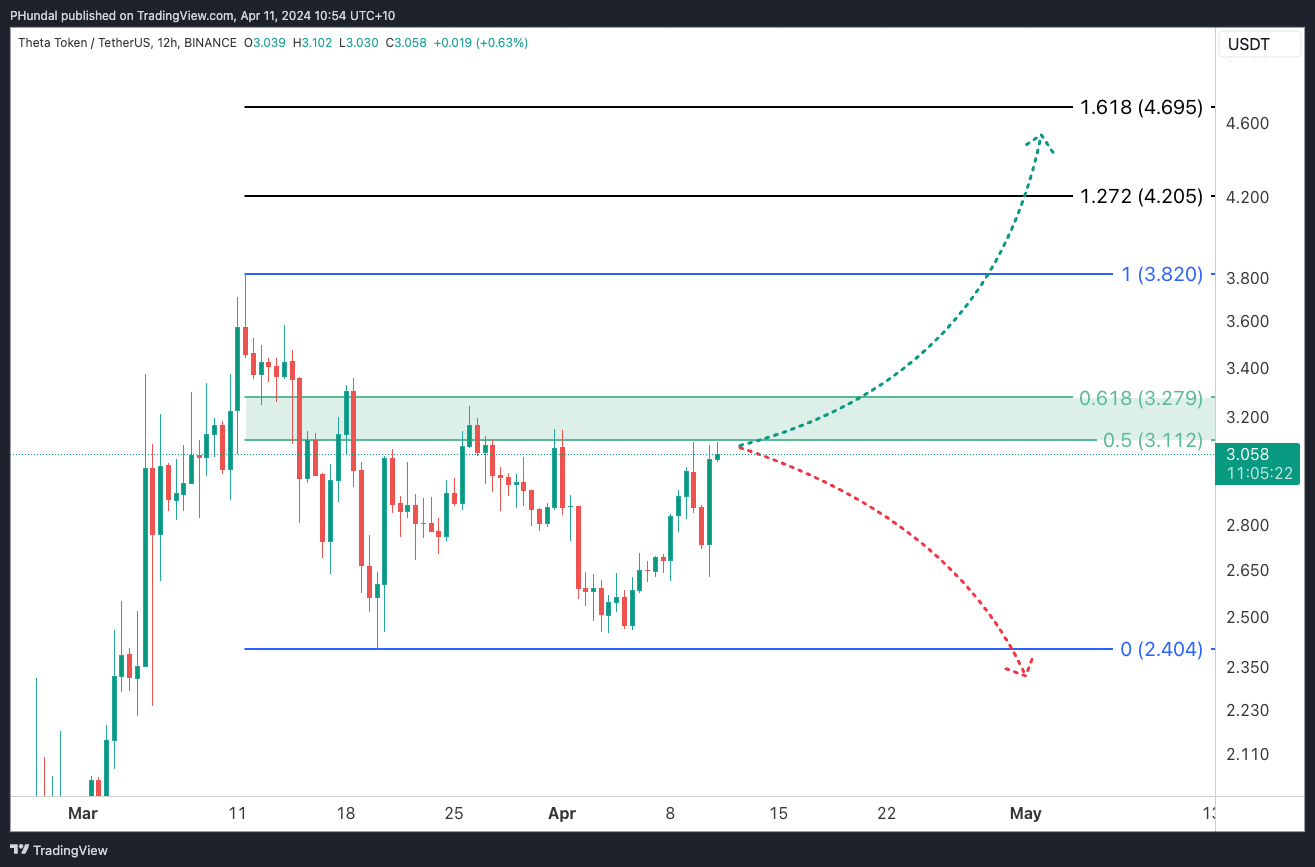
Using the Fibonacci tool, as explained above in KAS, below are two potential scenarios.
Bullish scenario
Market participants drive prices higher and remain above the 0.618 fib ($3.279). We could then see prices move towards the previous high ($3.820), the 1.272 ratio ($4.205) and the 1.618 ratio ($4.695).
Bearish scenario
Failure to hold and move higher above the 0.618 ratio could result in new lows under $2.404.
See you all again next week.
Keep up to date.
Stay informed and connected! I’m excited to announce my new YouTube channel, Crypto with Pav, where I dive into the latest trends in cryptocurrency, offering insights on what’s coming next and highlighting news and technical structure I believe is crucial.
I’m also on X.
Cheers!
Author
Pav Hundal
Pav Hundal, is a trader at heart. Making the transition from the FX markets to the dynamic world of cryptocurrency in 2017. With a keen eye for both technical and fundamental analysis, Pav places special emphasis on tracking macroeconomic conditions to build narratives around current trends. Currently, he lends his expertise as the Lead Market Analyst at Swyftx.