Advertisement
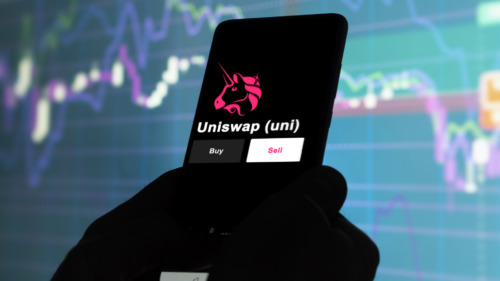
Uniswap (UNI) Price Surges 50% in November as DEX Trading Volume Reaches 5-Month High
The UNI price has increased significantly since October and is breaking out from a long-term descending resistance trend line.
Despite the increase, UNI has yet to reach a new yearly high. Will it do so?
Uniswap Breaks Out From Long-Term Resistance
The UNI price has traded above a key horizontal support area since June. More recently, it bounced inside this area in October (green icon) and began the current upward movement.
During this time, the UNI price followed a descending resistance trend line. The UNI price surge led to a high of $6.30 today, the first above this trendline in 480 days.
However, UNI has not reached a weekly close above this trend line yet.
There have been several positive news regarding Uniswap this week. After Changpeng Zhao’s resignation as Binance CEO and the appointment of his successor, Richard Teng, the crypto community is speculating that the Decentralized Exchange (DEX) interest will gain traction.
This is evident in the Uniswap Protocol’s monthly volume of $14.20 billion so far in November. This is the highest volume since the protocol did $16.20 billion in June, a value that could be surpassed by the end of the month.
The increased interest is also visible in the nearly $500 million daily trading volume for UNI.
What Are Analysts Saying?
Cryptocurrency traders and analysts on X are bullish on the future UNI price trend.
Advertisement
Crypto Faibik believes that the trend is bullish since UNI is in the process of breaking out from a long-term descending resistance trend line.
JJcycles is bullish because of both the price action and developments in the crypto industry. He stated that:
We have CZ saying he will spend more time in DeFi after his break. Should be more than enough of a catalyst to cause a significant breakout on the biggest spot swap protocol.
UNI Price Prediction: Can Price Confirm Reversal?
The weekly Relative Strength Index (RSI) gives a bullish outlook.
With the RSI as a momentum indicator, traders can determine whether a market is overbought or oversold and decide whether to accumulate or sell an asset.
Bulls have an advantage if the RSI reading is above 50 and the trend is upward, but if the reading is below 50, the opposite is true.
The RSI is increasing and is above 50, both signs of a bullish trend. Additionally, the indicator has generated a bullish divergence (green). This occurs when a momentum increase accompanies a price decrease. It usually leads to bullish trend reversals, as was the case of UNI.
The bullish trend will be confirmed by a breakout from the long-term descending resistance trend line. If that happens, the UNI price can surge by 20% and reach the $7.40 resistance area. It could potentially move above the yearly high at $7.61.
Despite this bullish UNI price prediction, failure to close above the long-term descending resistance trend line can lead to a 35% drop to the closest support at $4.