TradingView Launches New Bitcoin Timeline

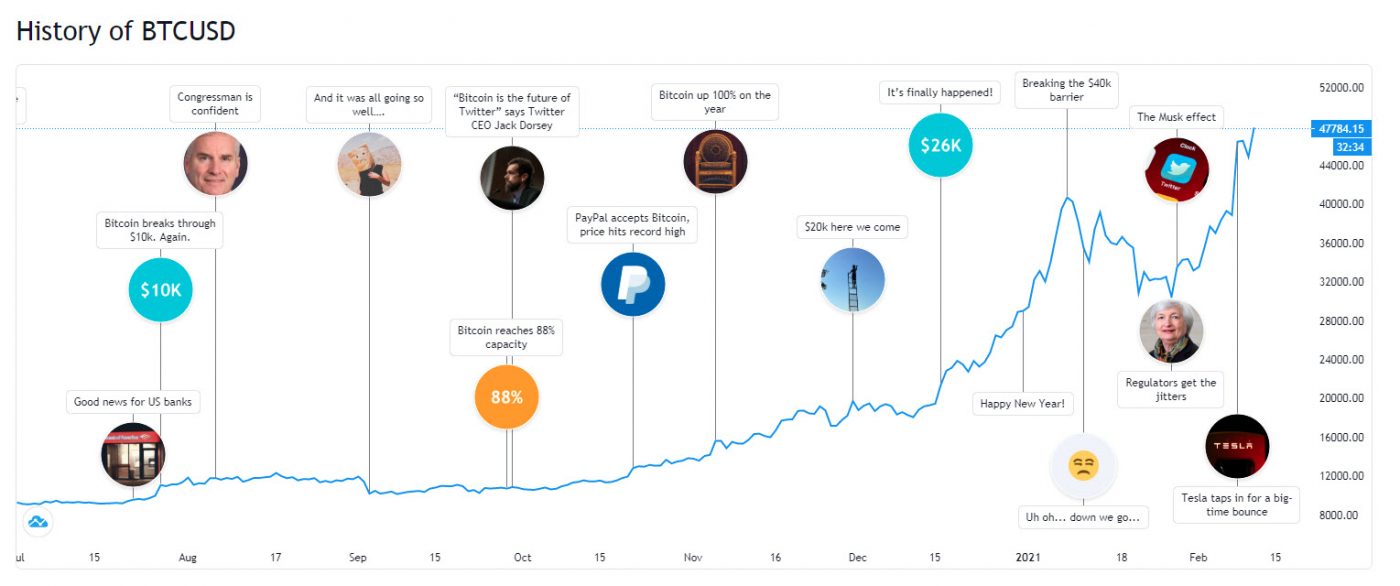
Popular charting tool TradingView, just announced their Bitcoin Timeline which shows the big events that have happened to Bitcoin.
The timeline goes as far back as 2009 when Bitcoin started (although the chart starts at 2011). You can use your mouse/finger to swipe through the chart left/right and reveal more events.

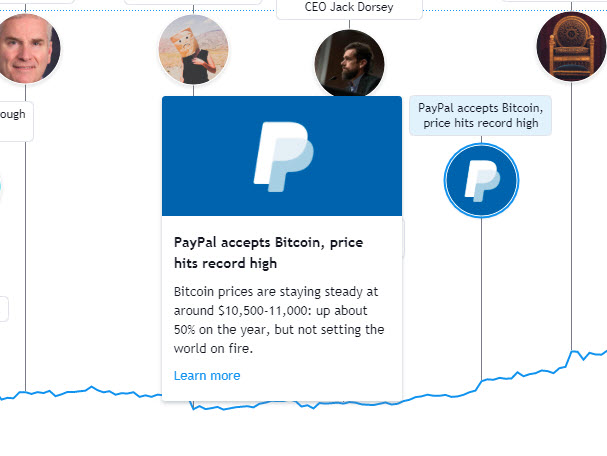
You can hover the icons to reveal more information, and when you click learn more it goes to a full section of description of what happened.

The timeline descriptions are really informative, a lot of effort must have gone into these! Kudos TradingView!
Advertisement

Great to see stuff like this get developer, thanks TradingView.


