Top 3 Coins to Watch Today: MANA, METIS, SC – July 19 Trading Analysis

Let’s take a closer look at today’s altcoins showing breakout signals. We’ll explain what the coin is, then dive into the trading charts and provide some analysis to help you decide.
1. Decentraland (MANA)
Decentraland MANA defines itself as a virtual reality platform powered by the Ethereum blockchain that allows users to create, experience, and monetise content and applications. In this virtual world, users purchase plots of land that they can later navigate, build on and monetise. Decentraland uses two tokens: MANA and LAND. MANA is an ERC-20 token that must be burned to acquire non-fungible ERC-721 LAND tokens. MANA tokens can also be used to pay for a range of avatars, wearables, names and more on the Decentraland marketplace.
MANA Price Analysis
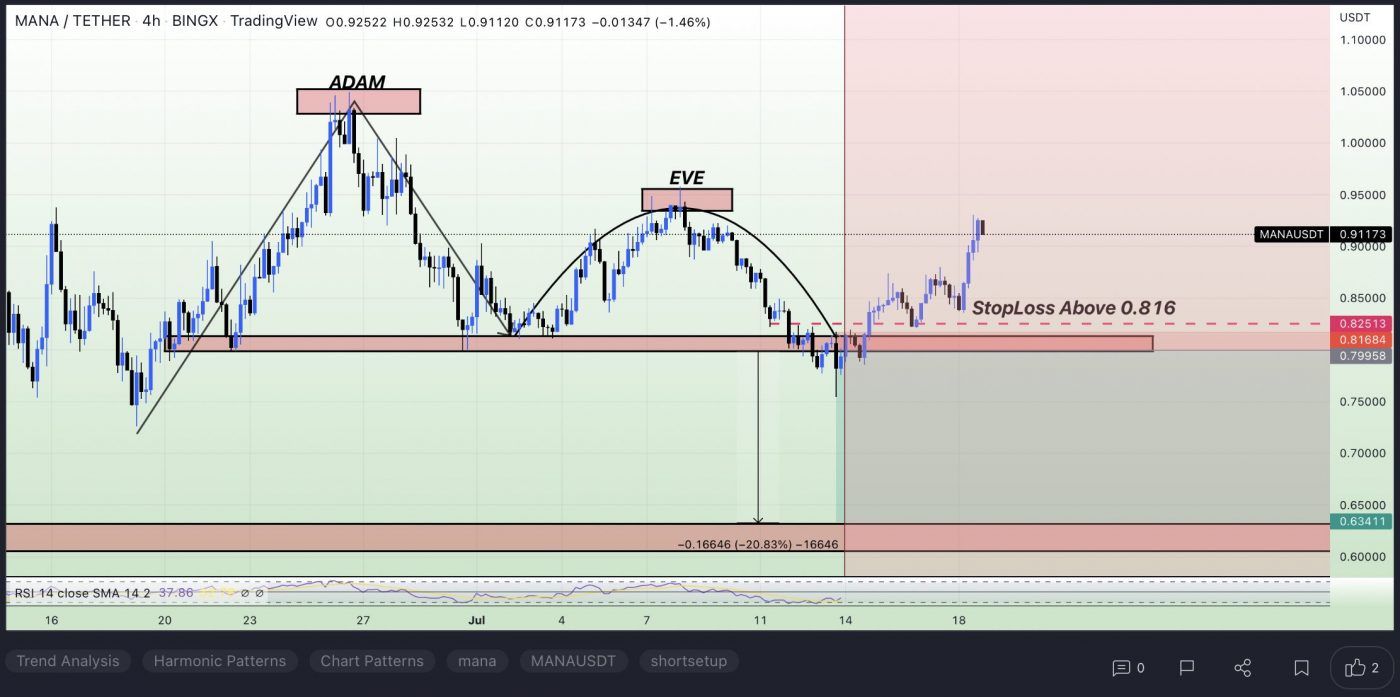
At the time of writing, MANA is ranked the 35th cryptocurrency globally and the current price is US$0.9145. Let’s take a look at the chart below for price analysis:

MANA dropped 80% since March 1 and made a low near $0.5800. It has consolidated above this low since May 12.
The price might find support between $0.8808 and $0.8537. This level saw accumulation on July 17, contains the 9 and 18 EMAs, and borders the July monthly open.
A deeper retracement could reach near $0.8290. A drop to this level would rebalance more inefficient trading on the daily chart. It could also run bulls’ stops below today’s opening price and July 16’s swing low.
The price is testing the closest resistance, at $0.8962. Bears entered shorts here before last week’s drop. It’s also near the 40 EMA.
If this resistance breaks, $0.9346 to $0.9923 may provide the next resistance. This area is between the 61.8% and 78.6% retracement of the last month’s downtrend. Bulls also rejected bulls here in late June on the weekly chart.
A more significant rally might reach an area of inefficient trading on the monthly chart from $1.0932 to $1.3375. This move would sweep most bears’ trailed stops above relative equal highs up to this level. Yet, bulls aiming for this level may want to be cautious since the overall trend is still bearish.
If the downtrend continues, $0.7255 may offer the next support. A drop to this level would run bulls’ stops under the June 18 and July 13 swing lows. It’s an area where bulls have rejected bears many times since September 2021.
Under this level, support might be near the last downswing’s 50% extension, from $0.6290 to $0.5800. Bulls rejected bears here in Q2 2021 on the monthly and weekly charts. Near this level, stops near early May’s and last September’s swing lows give bears an attractive target.
2. MetisDAO (METIS)
METIS is based on the spirit of Optimistic Rollup, building an easy-to-use, highly scalable, low-cost and fully functional Layer 2 framework (Metis Rollup) to fully support the application and business migration from Web 2.0 to Web 3.0. Its scalable protocol supports a wide range of use cases, including NFT platforms, decentralised Reddit-like social platforms, open-source developer communities, influencer communities, gaming communities, freelancer communities, crowdfunding, yield farming, DEX trading, and much more.
METIS Price Analysis
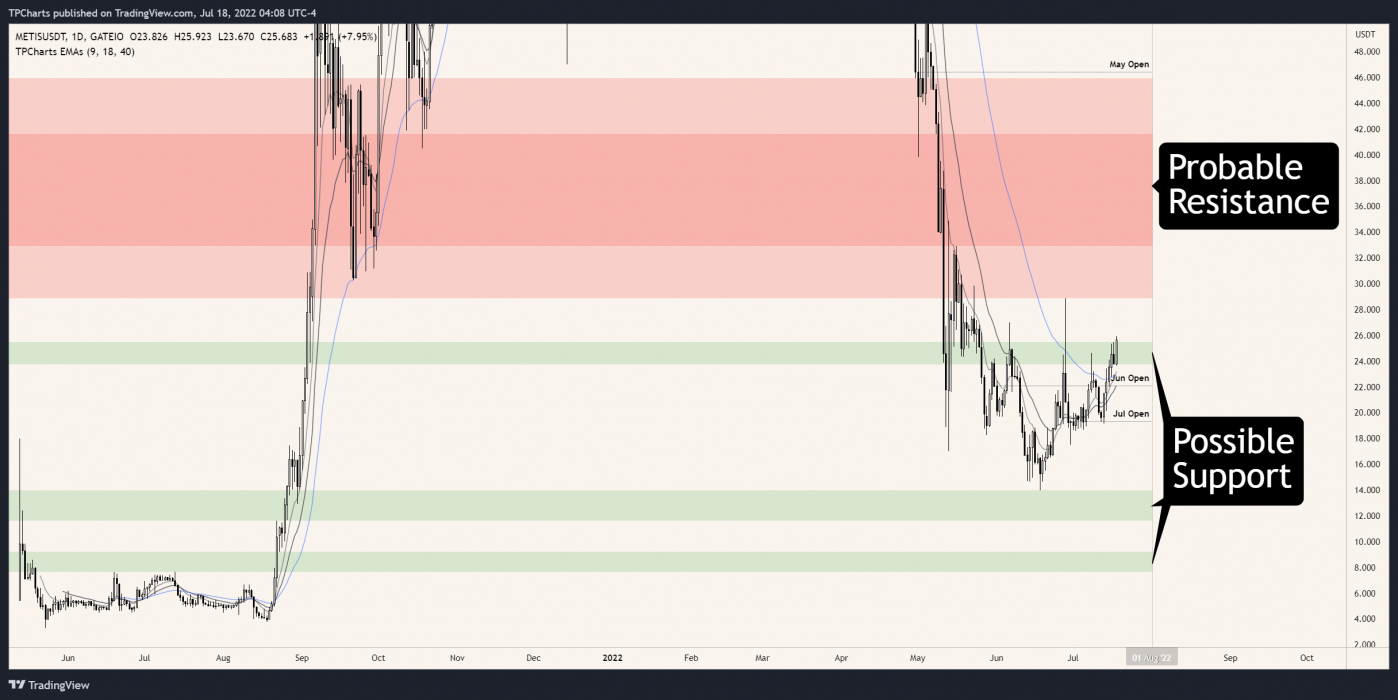
At the time of writing, METIS is ranked the 238th cryptocurrency globally and the current price is US$29.60. Let’s take a look at the chart below for price analysis:

METIS plummeted 91% from the end of March to mid-June. Since then, it has consolidated while creeping upwards. This upward movement accelerated last week.
An area between $25.518 and $23.746 should provide the closest support if the bullish rally continues. This level is near the top of early June’s accumulation on the weekly chart. It will also soon contain the 9 EMA.
The closest resistance may be at $28.90. Reaching this level would sweep bears’ stops above June 28’s swing high. Many swing highs above this level could continue attracting the price upward.
An area of inefficient trading on the weekly chart, between $32.955 and $41.634, may be the primary goal for bulls. The top of this range, above $39.518, also shows inefficient trading on the daily chart. It gives bulls a logical place to take profits if the price can reach this far.
Suppose the price resumes the downtrend without reaching significantly higher. In that case, higher timeframes suggest that $14.00 might be the next possible support level. This area, down to $11.641, shows inefficient trading on the monthly and weekly charts. It’s also under the June 18 swing low, giving bears an attractive target for hunting bulls’ stops.
A continued decline might reach a zone between $9.211 and $7.690. This area shows inefficient trading on the monthly and weekly charts. It also borders the July 2021 accumulation zone’s high.
3. Siacoin (SC)
Siacoin SC is the native utility token of Sia, a blockchain-based distributed, decentralised cloud storage platform. Sia acts as a secure, trustless marketplace for cloud storage in which users can lease access to their unused storage space. Agreements and transactions are enforced with smart contracts, and Siacoin is the medium of exchange for paying for storage on the network. The main goal of the project is to become the “backbone storage layer of the internet”.
SC Price Analysis
At the time of writing, SC is ranked the 129th cryptocurrency globally and the current price is US$0.004232. Let’s take a look at the chart below for price analysis:

SC crashed 79% from its April high and set a low at $0.003129 in mid-June before beginning a consolidation.
The current price, near $0.004143, could support the next upward move. This level is at the high of late June’s consolidation.
Above, an area near $0.004350 may offer the first resistance. This level is at the bottom of inefficient trading on the weekly and daily charts. It’s also a place where bulls rejected bears in early May.
A move to this level might reach slightly higher. An area of inefficient trading on the weekly chart, between $0.004560 and $0.005242, could prompt a reversal. This area contains the 61.8% retracement and pockets of inefficient trading on the daily chart.
If the rally continues, $0.005963 offers the next logical target for bulls. Moving to this level would sweep bears’ stops above relative equal highs into inefficient trading on the monthly and weekly charts.
Should the downtrend resume, $0.003449 may offer the closest higher-timeframe support. Bulls and bears have taken turns rejecting each other near this level on higher-timeframe charts. It also saw accumulation in December 2020 before a parabolic rally. Reaching this level would sweep bulls’ stops under July 1’s swing low.
A drop to this level could easily reach $0.003140. A move to this level would sweep bulls’ stops under June’s low into the upper half of October 2020’s accumulation.
Learn How to Trade Live!
Join Dave and The Crypto Den Crew and they’ll show you live on a webinar how to take your crypto trading to the next level.

Where to Buy or Trade Altcoins?
These coins have high liquidity on Binance Exchange, so that could help with trading on AUD/USDT/BTC pairs. And if you’re looking at buying and HODLing cryptos, then Swyftx Exchange is an easy-to-use popular choice in Australia.


