Top 3 Coins to Watch Today: AUDIO, ICP, SAND – August 23 Trading Analysis

Let’s take a closer look at today’s altcoins showing breakout signals. We’ll explain what the coin is, then dive into the trading charts and provide some analysis to help you decide.
1. Audius (AUDIO)
Audius AUDIO is a decentralised music-sharing and streaming protocol that facilitates direct transactions between listeners and creators, giving everyone the freedom to distribute, monetise, and stream any audio content. Audius aims to align the interests of artists, fans and node operators through its platform powered by its native AUDIO token. Artists can upload music, stored and distributed by content and discovery nodes, that fans can listen to for free.
AUDIO Price Analysis
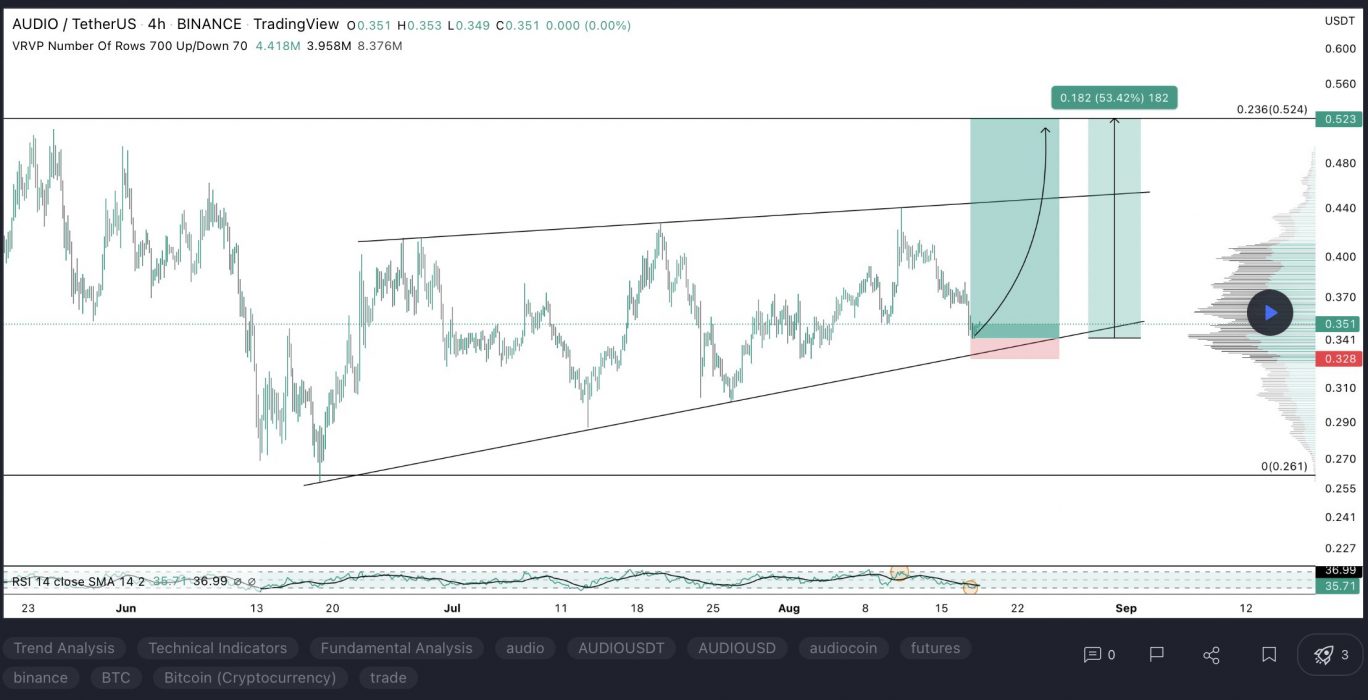
At the time of writing, AUDIO is ranked the 122nd cryptocurrency globally and the current price is US$0.2989. Let’s take a look at the chart below for price analysis:

AUDIO has been consolidating between approximately $0.509 and $0.282 since early May 2022. The high end of this range, from $0.496 to $0.563, could provide significant resistance. A rally to this level would partially fill an area of inefficient trading on the monthly, weekly, and daily charts. It would also run bears’ stops above the summer’s consolidation.
The swing high near $0.440 could provide a closer resistance. If the price can reach this level, it will run bears’ stops above the recent sharp move downward. It’s also near the June monthly open.
The closest resistance may be an area between $0.352 and $0.377. This level shows buying before August 11’s run on bears’ stops, contains the 40 EMA, and has inefficient trading on the daily chart.
Currently, the price is testing possible support near $0.306. At this level, bulls rejected bears in mid-June near the bottom of inefficient trading on the monthly chart. The price has already swept some bulls’ stops as it creates relative equal lows.
These relative equal lows may suggest that this level will later break. Yet, in the short term, it could prompt a rally toward resistance.
If the price breaks down from its consolidation range, $0.215 may provide the next higher-timeframe support. Here, the weekly chart shows accumulation before early 2021’s rally.
A sustained downtrend could reach $0.077 or below, where the monthly chart shows inefficient trading. Higher-timeframe support below this level is unclear due to a lack of historical price action.
2. Internet Computer (ICP)
The Internet Computer ICP is the world’s first blockchain that runs at web speed with unbounded capacity. It also represents the third major blockchain innovation alongside Bitcoin and Ethereum. The Internet Computer scales smart contract computation and data, runs them at web speed, processes and stores data efficiently, and provides powerful software frameworks to developers. By making this possible, it enables the complete re-imagination of software, providing a revolutionary new way to build tokenised internet services, pan-industry platforms, decentralised financial systems, and even traditional enterprise systems and websites.
ICP Price Analysis
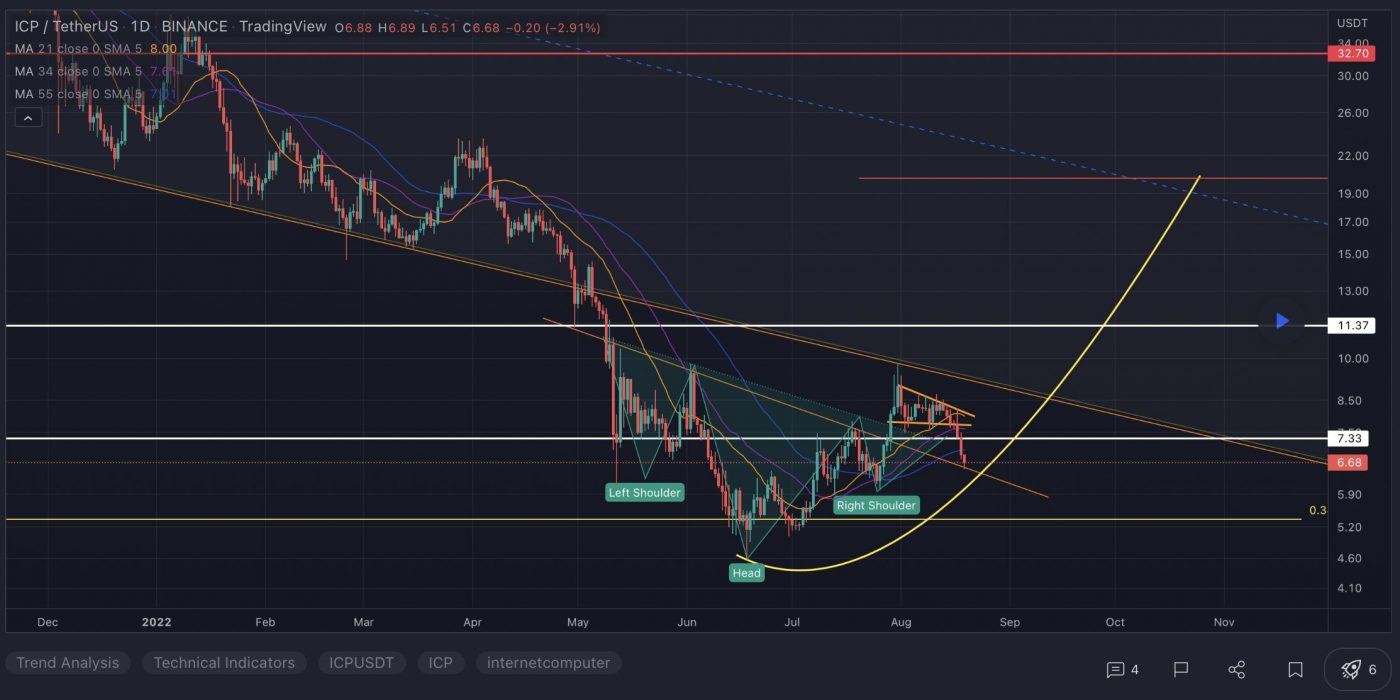
At the time of writing, ICP is ranked the 35th cryptocurrency globally and the current price is US$6.22. Let’s take a look at the chart below for price analysis:

ICP has consolidated since mid-May and is approaching the bottom of this range. An area near $5.95 could provide support. It’s below relative equal lows, offering bears an attractive target, and shows inefficient trading on the daily chart.
A run to this level may drop slightly lower, near $5.54, to touch the midpoint of accumulation on the weekly chart. No historical price action exists to suggest support below this area. The 50% extension on late July’s bullish impulse could hint at possible support and a bearish target near $4.25.
The closest resistance might exist between $7.17 and $7.60. This area shows inefficient trading on the daily chart above the midpoint of the recent drop. It also contains the 18 and 40 EMAs. If the price does break through this level, it could retest the August monthly open near $8.99. Bears rejected bulls here on all timeframes.
A more substantial rally may run bears’ stops above relative equal highs near $9.80. This potential move could reach into an area of inefficient trading on the monthly and weekly charts above, up to $11.28. Stronger resistance might begin near $10.24, where the daily chart showed brief distribution on May 10.
3. The Sandbox (SAND)
The Sandbox SAND is a blockchain-based virtual world allowing users to create, build, buy and sell digital assets in the form of a game. By combining the powers of decentralised autonomous organisations (DAOs) and non-fungible tokens (NFTs), the Sandbox creates a decentralised platform for a thriving gaming community. The Sandbox employs the powers of blockchain technology by introducing the SAND utility token, which facilitates transactions on the platform.
SAND Price Analysis
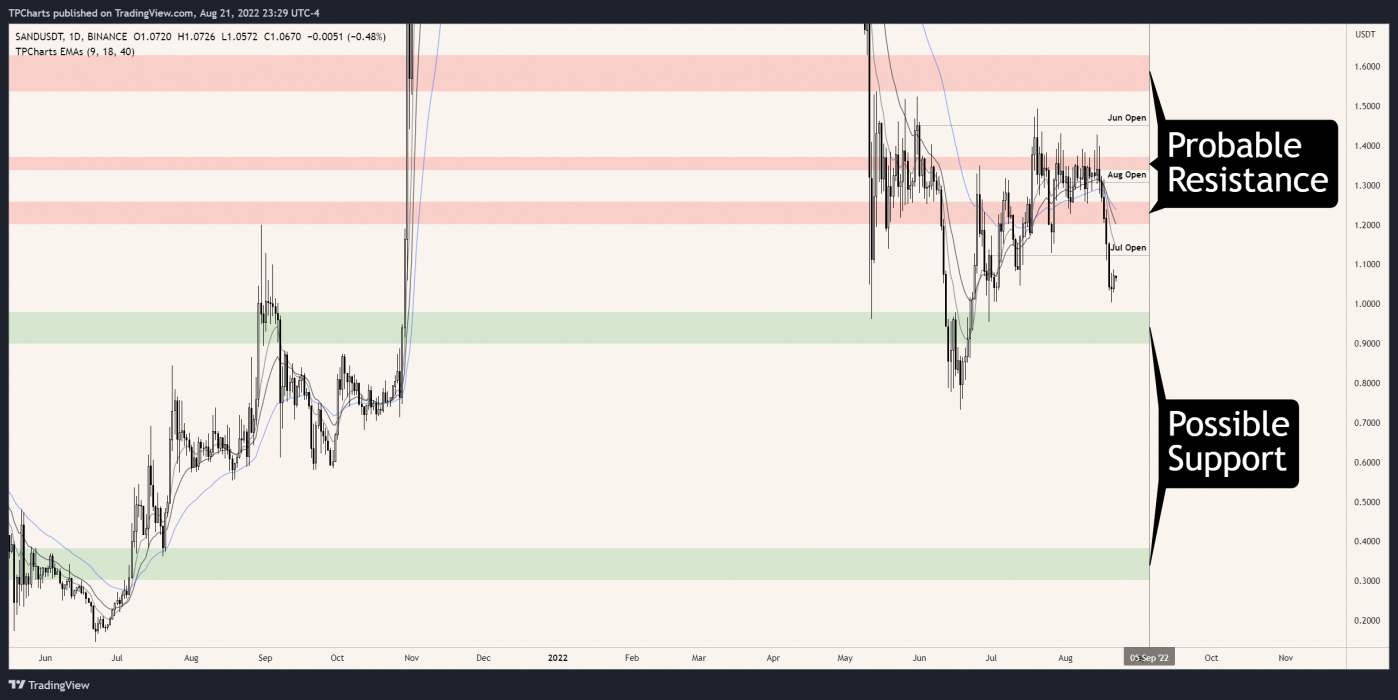
At the time of writing, SAND is ranked the 38th cryptocurrency globally and the current price is US$1.02. Let’s take a look at the chart below for price analysis:

SAND has also been consolidating since mid-May and is retesting its range lows. An area between $0.9798 and $0.8995 offers the highest odds of holding if bulls want to keep the price in its range. This area near the range’s lows is the upper half of accumulation on the weekly chart. It also ran stops under early May’s swing low.
If the downtrend resumes, the price may reach as low as $0.3827. This area shows inefficient trading formed on the weekly chart as July 2021’s rally kicked off. The price has not yet indicated that it will head for this level.
Inefficient trading near $1.2026 may provide the first resistance. This area contains the 18 and 40 EMAs and overlaps with old swing lows.
Bears rejected bulls in late July and early August near $1.3384. This area, just above the August monthly open, could provide resistance again.
An area of inefficient trading from $1.5373 to $1.6298 offers an attractive target to bulls and could provide significant resistance. Reaching this gap would allow bulls to run many bears’ stops above the summer’s range highs.
Learn How to Trade Live!
Join Dave and The Crypto Den Crew and they’ll show you live on a webinar how to take your crypto trading to the next level.

Where to Buy or Trade Altcoins?
These coins have high liquidity on Binance Exchange, so that could help with trading on AUD/USDT/BTC pairs. And if you’re looking at buying and HODLing cryptos, then Swyftx Exchange is an easy-to-use popular choice in Australia.


