Advertisement
On the Radar – Coins to Watch 09/05

- Looking at the data, what has happened after the Bitcoin halving in the past? And why broader global liquidity levels are worth paying attention to.
- Bullish and bearish scenarios for Bitcoin from here.
- Altcoin analysis: ENA, RNDR
After a red month to the end of April and a bounce back at the start of May, it isn’t a stretch to think that confidence in the market might be a little tattered and confused compared to February and March.
If you’re wondering whether the current market cycle has ended, now might be a good time to take a step back and assess Bitcoin and the broader markets.
That’s what I’m going to do today, let’s explore some data and revisit what we know about when we have been in similar underlying conditions.
Let’s dive in!
Bitcoin’s Historic Performance Post-Halving
Historically, Bitcoin has shown that previous bull runs have made the majority of their move within 2 to 18 months after the halving in previous epochs (halving cycles).
As a reminder, the Bitcoin halving occurred on the 19th of April, which puts us at the beginning of this timeline.
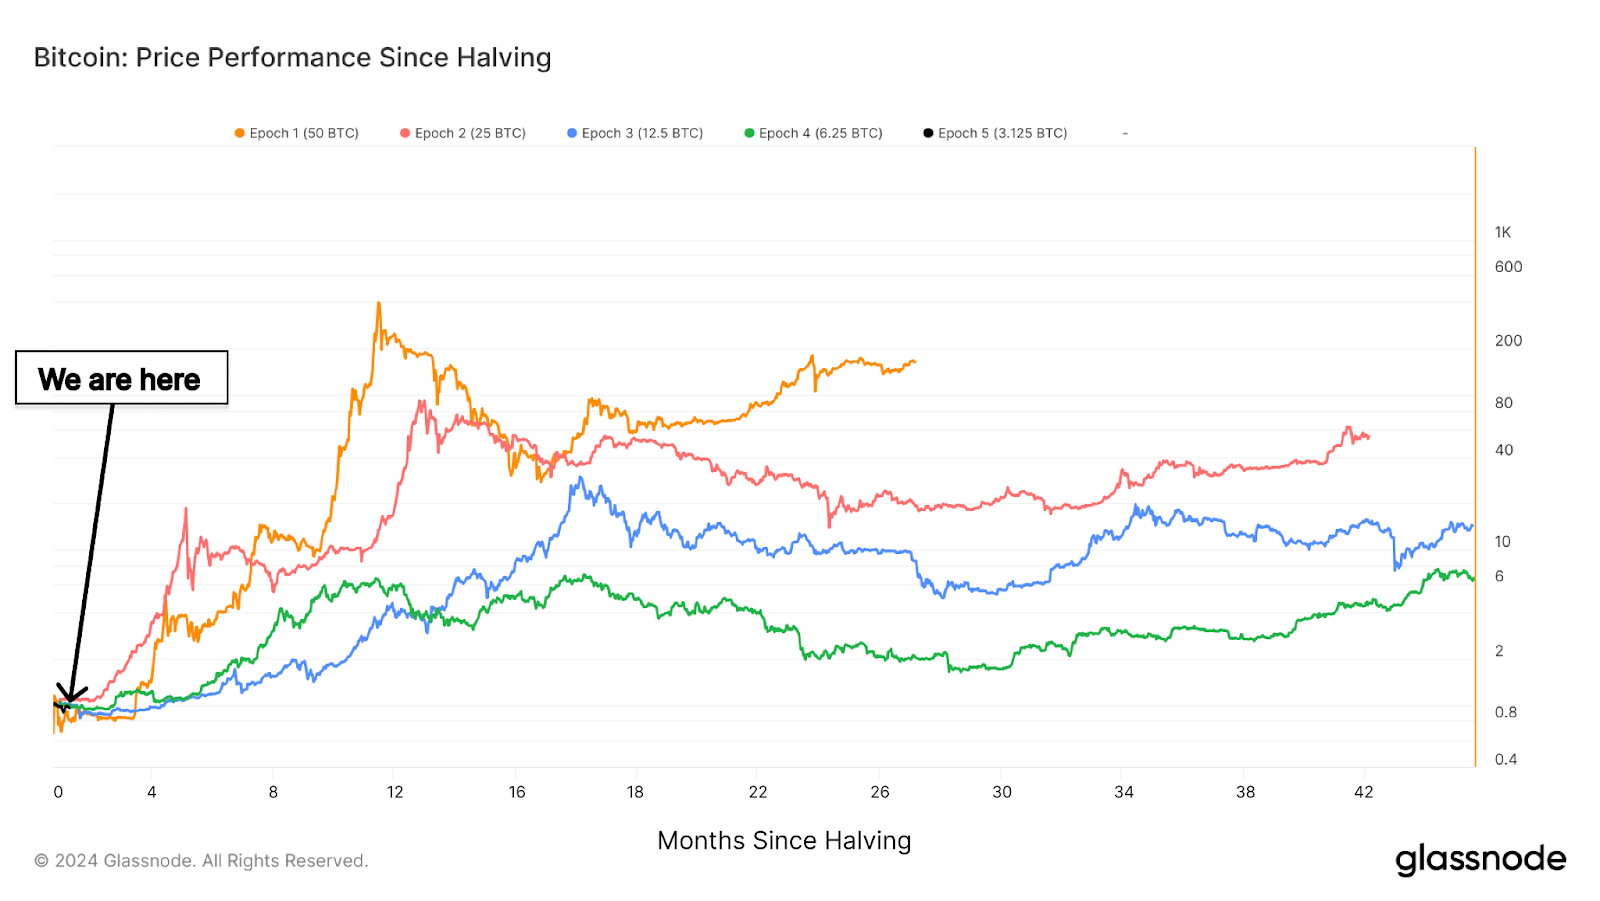
We can also see that over time, Bitcoin’s cycle-on-cycle returns have diminished. After 18 months, there has been a period of significant drawdown from the highs. Often labelled as the bear market phase.
Global Liquidity
Cryptocurrencies have thrived in high-liquidity environments, where governments and monetary policymakers have opened the taps for more cash and credit to flow into economies and financial markets.

The above is a model created by CrossBoard Capital, showing historic periods where liquidity is high (orange line) and the demand for ‘safe’ assets like Treasuries falls (black line) leading investors to seek higher returns in ‘riskier’ assets.
Since 2022, we have seen a regime of money-tightening policies across the globe in a battle to bring down inflation since the Covid pandemic and the stimulus provided during those times.
Advertisement
According to this model, we are at a phase where global liquidity is at historical lows not seen since 2006.
👉Historically, we can also line up Bitcoin’s year-on-year performance alongside this macro modelling for liquidity. Periods of similar underlying conditions can be seen during 2013, 2017 and 2020. Each of these years yielded at least triple figure annualised returns for Bitcoin.
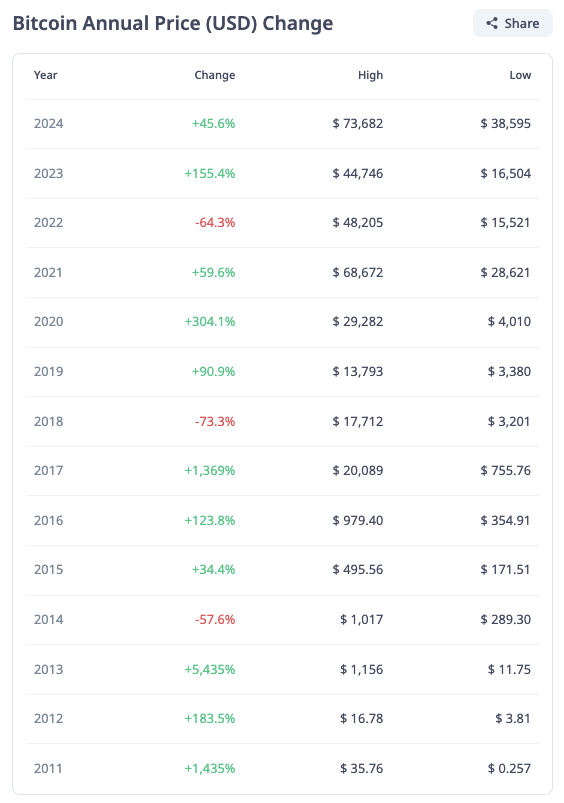
As always – it’s important to remember that data alone doesn’t guarantee what happens next. But, it does help provide some colour for how similar conditions have unfolded in the past.
Related: Revolutionising Blockchain: BOB Merges Bitcoin’s Security with Ethereum’s Innovation
Bitcoin – BTC
Currently, we are at a point where either bulls or bears could really take the cake. Likely what happens next will also drastically impact altcoins. We’ve seen in the past how a -5% move on Bitcoin can spell double-digit losses for alts.
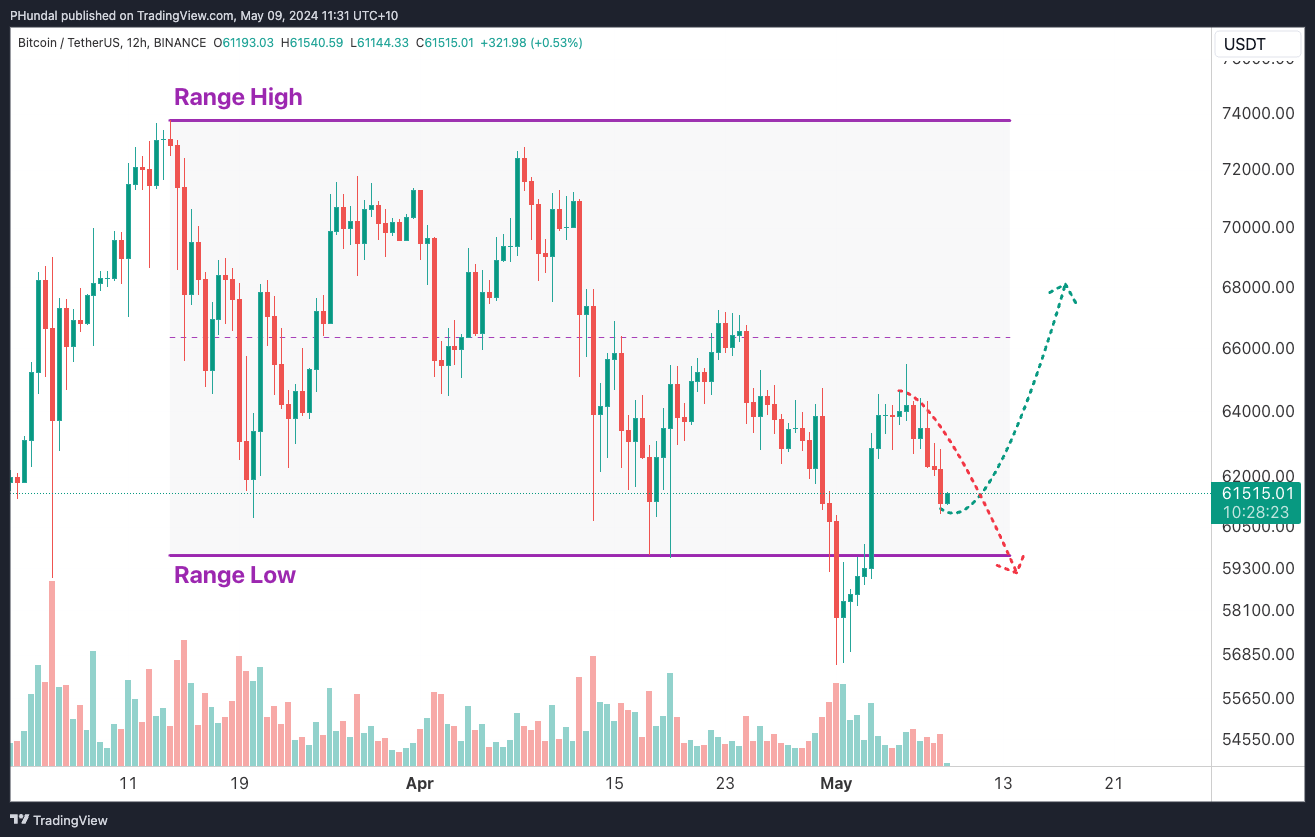
Bullish scenario
Price finding support above the current Range Low region in purple, and then moving towards $70,000 USD.
Bearish scenario
Bears remain in control, and if we move outside this range we could see new lows under $56,000 USD.
Ethena – ENA
A recent new listing in the space, Ethena is a DeFi project that has been appearing on the top performers list in recent weeks. Below is some analysis on what could develop using range analysis.
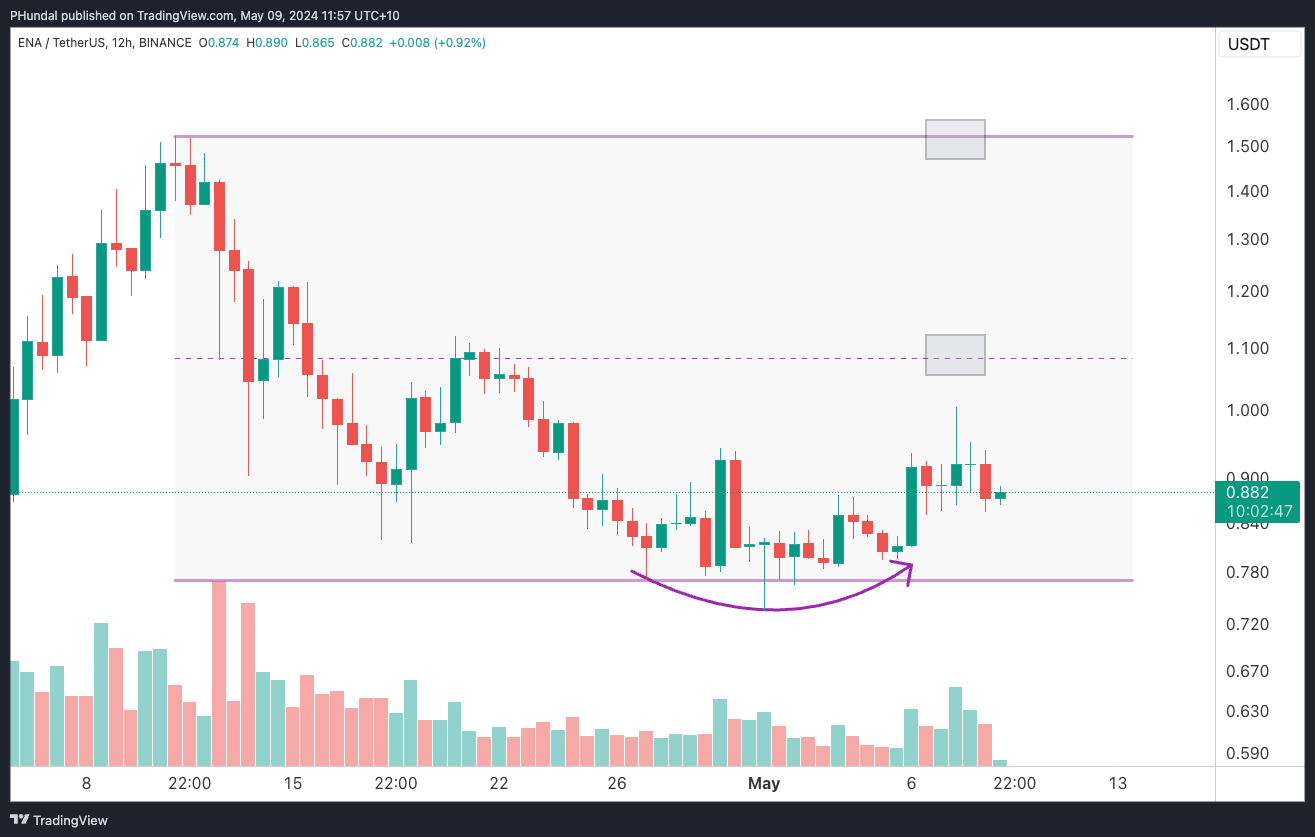
Bullish scenario
Having reclaimed the current range low, the next targets for bulls could be the range mid-point of $1.08 and the range high $1.52.
Bearish scenario
Failure to push higher could result in new lows, under $0.73.
Related: Analyst Predicts Bitcoin Could Reach $265K and Suggests This Altcoin as a Strong Buy
Render – RNDR
A standout performer for a long time now, it continues to lead the pack appearing in the top movers in the last seven days. Here is some analysis on Render using Fibonacci retracements.
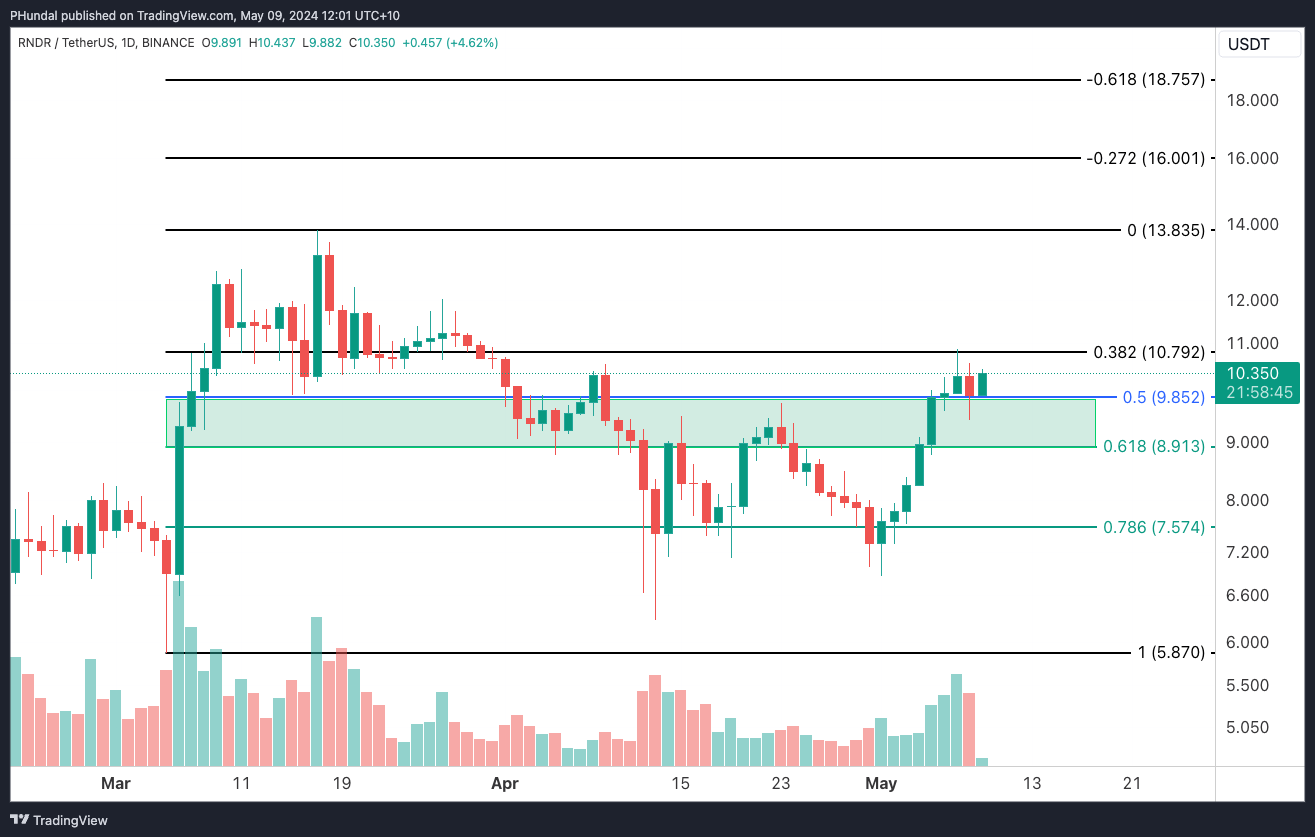
Bullish scenario
Prices need to hold here above the midpoint of this Fibonacci range, having successfully moved higher from the golden ratio (0.618). Potential targets here could be the top of the range $13.835, $16.001 and $18.757 respectively.
Bearish scenario
Failure to hold above the golden 0.618 ratio, could see new lows under $5.870.
See you all again next week.
Keep up to date.
Stay informed and connected! I’m excited to announce my new YouTube channel, Crypto with Pav, where I dive into the latest trends in cryptocurrency, offering insights on what’s coming next and highlighting news and technical structure I believe is crucial.
I’m also on X.
Cheers!
Author
Pav Hundal
Pav Hundal, is a trader at heart. Making the transition from the FX markets to the dynamic world of cryptocurrency in 2017. With a keen eye for both technical and fundamental analysis, Pav places special emphasis on tracking macroeconomic conditions to build narratives around current trends. Currently, he lends his expertise as the Lead Market Analyst at Swyftx.