New Record: Bitcoin Realised Market Cap Hits All-Time High

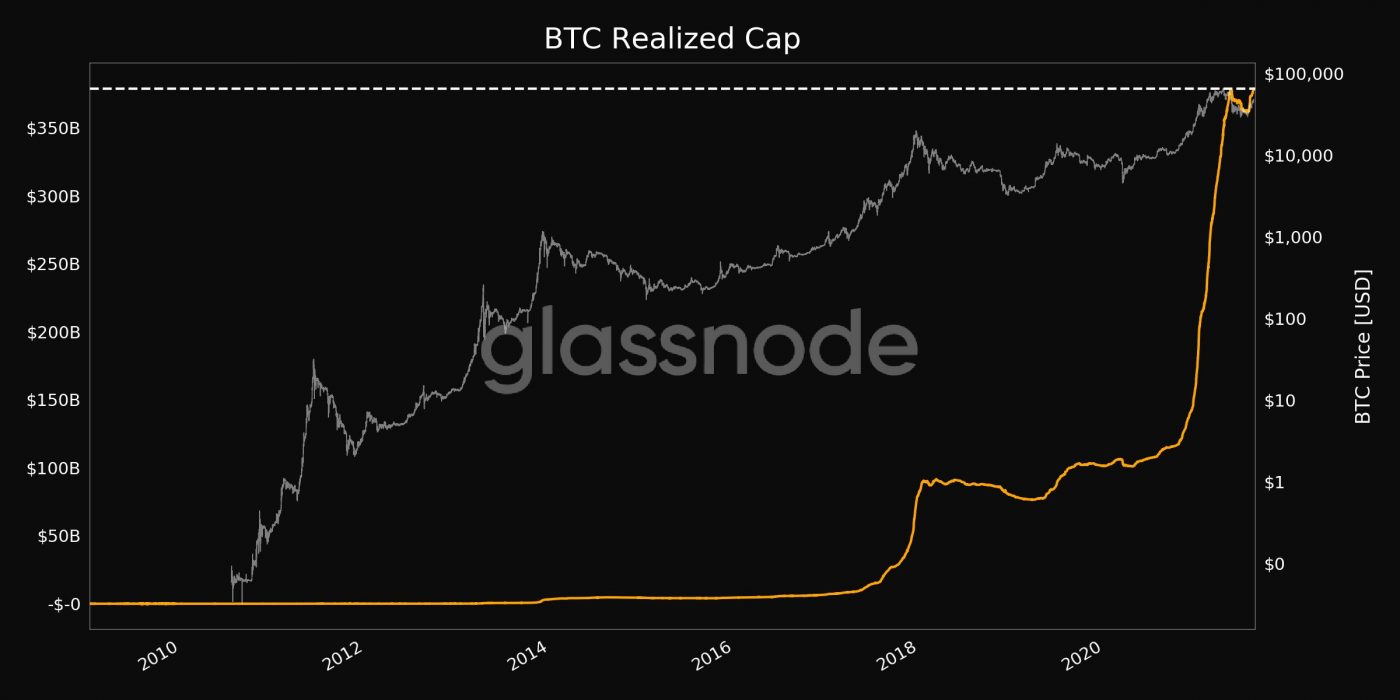
While much of the focus has been on its recent run on the back of strong fundamentals, bitcoin quietly achieved a new milestone – hitting an all-time-high of U$378 billion in “realised market cap”.

What is Realised Market Cap?
The standard measurement of market capitalisation is a simple multiplication of all coins in circulation by the current price. At the time of publication, bitcoin’s total market cap is $US899 billion.
Realised market cap, by contrast, is a method of assessing bitcoin’s market cap based on the price at which each coin last moved. Put differently, it measures how much “active” money is in the bitcoin market.
Realised market cap therefore measures the size of bitcoin’s active market cap, which specifically excludes holdings that haven’t changed hands for a long time (ie, long-term HODLers and Satoshi’s stash).
To determine realised market cap, data providers like Glassnode assign time-sensitive values to coins. If, for example, a coin last moved in 2018, when the price of bitcoin was US$6,000, that coin is then priced at US$6,000 rather than at today’s price.
What Does it Mean?
Realised market cap is argued to provide a better estimate of the size of the “active” bitcoin market. This is perhaps reflected in the data, with 1.2 million new users joining the network in the past month.
It may also be useful to note that where the market cap trades above realised cap, the market is in aggregate profit. The inverse applies when market cap trades below realised cap.
If this all sounds a bit technical, Willy Woo breaks it down in simple terms:
Good Times Continue
Bitcoin is up 8 percent on the week and is currently trading at US$47,800. Analysts suggest it may continue to trade in the US$45,000-$50,000 band for some time, while others are eyeing a strong breakout in coming weeks above US$50,000.
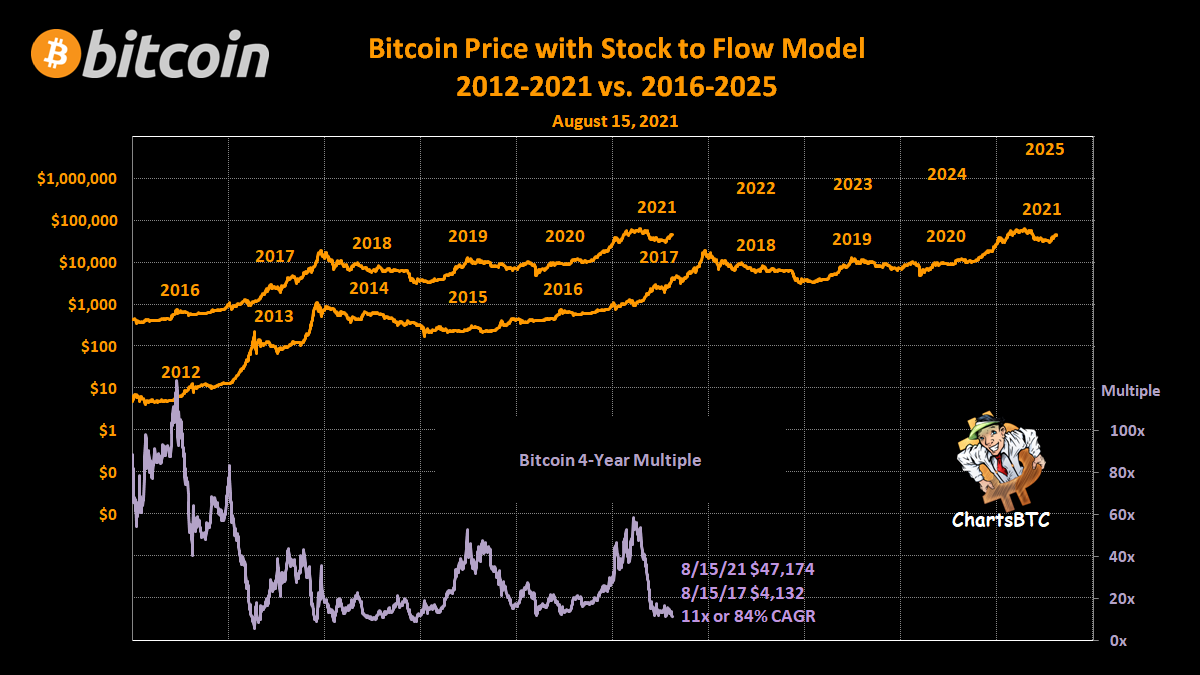
For those less interested in short-term price fluctuations and who are in it for the long haul, the chart below offers a useful roadmap of where bitcoin may be going in the next few years. On a linear chart, bitcoin is all over the map. However, on a log-chart (as shown below), the growth trajectory in bitcoin is self-evident.
The easiest, and potentially best, strategy is to simply stack sats and HODL.


