


Advertisement
What is the Fear and Greed Index?
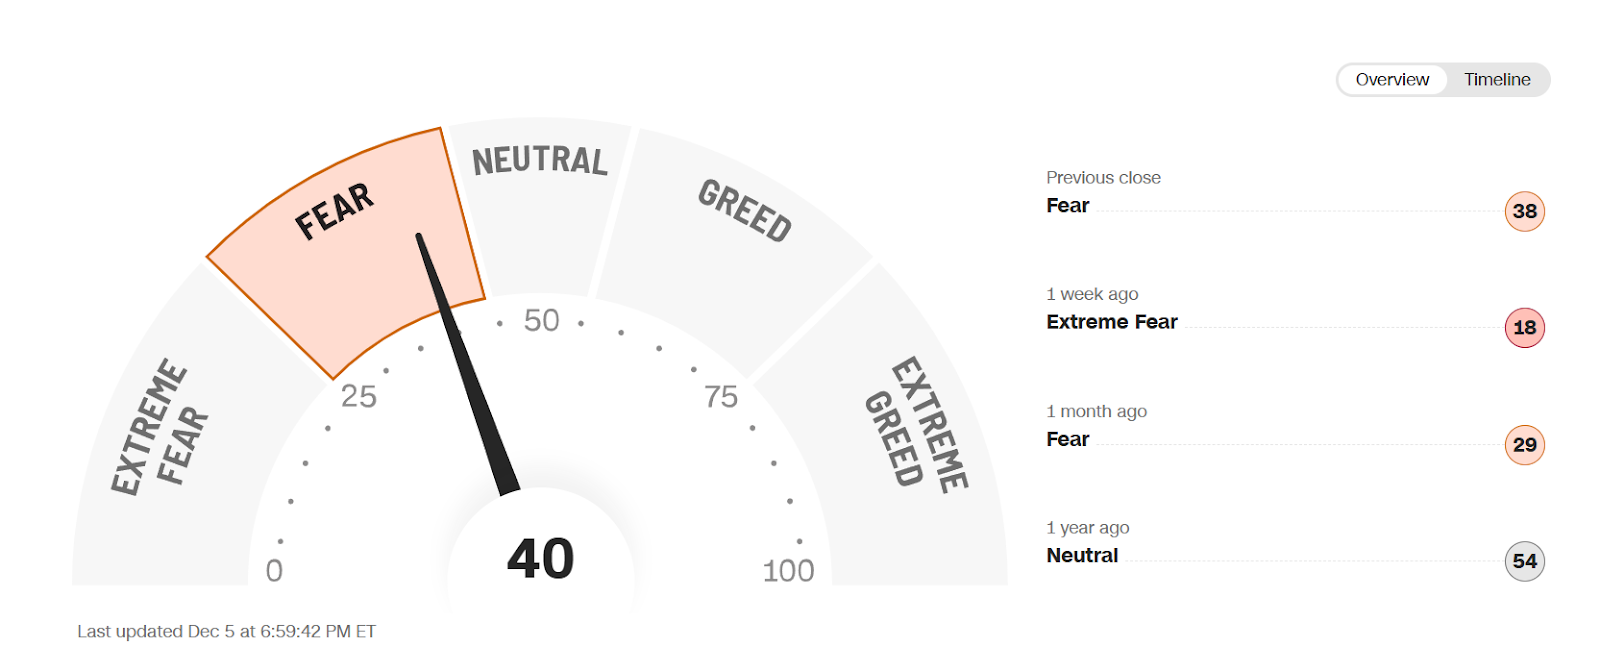
The Fear and Greed Index is a simple way to track investor mood. It depicts market sentiment as a number from 0 to 100, based on the idea that fear pushes people to sell and greed pushes them to buy.
It’s a pretty straightforward scale:
- 0 to 24 means extreme fear, often linked with sharp price drops and signs the market may be oversold.
- Readings from 25 to 49 still show fear and a generally negative outlook.
- A value around 50 is neutral, with no strong tilt either way.
- Scores between 51 and 74 point to growing greed and buying pressure, while 75 to 100 signals extreme greed, when optimism is high and assets may be overvalued.
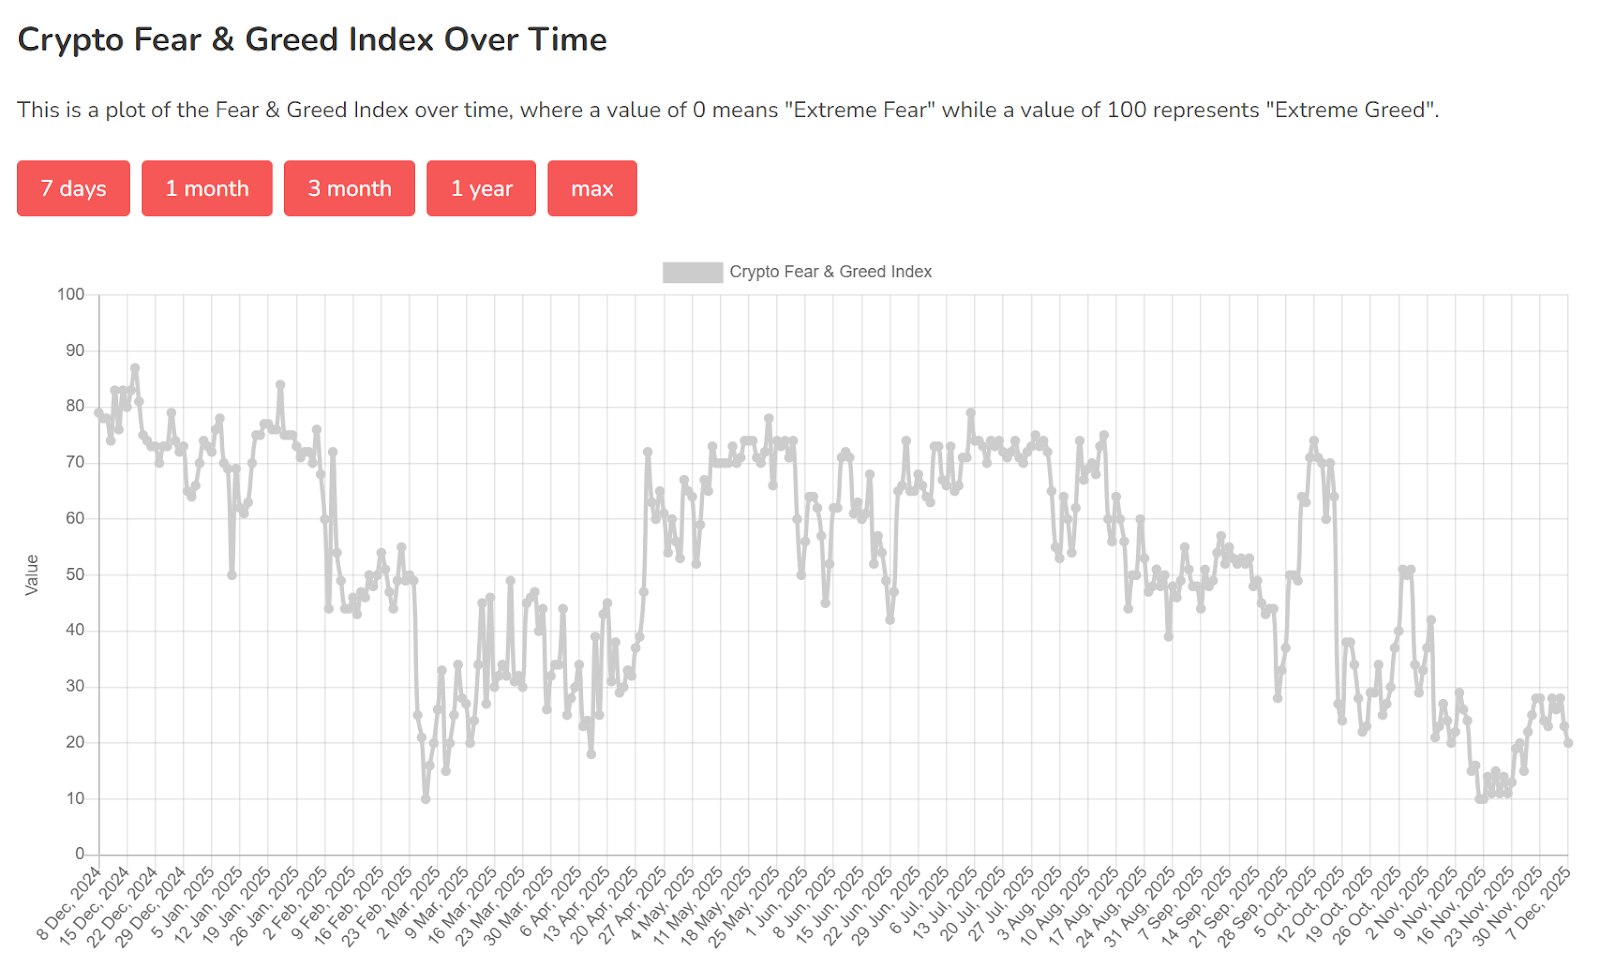
For crypto, the best-known version is the Crypto Fear and Greed Index from alternative.me. It uses different inputs that fit the digital asset market, including volatility, Bitcoin’s (BTC) share of total crypto market value, Google search trends, social media activity, and other sentiment data. It updates frequently and tracks a broad set of coins, with BTC a major driver.
How is the Fear and Greed Index calculated?
In any version, The Fear and Greed Index works similarly: take several market and sentiment inputs, turn each into a “fear or greed” score from 0 to 100, then condense them into one number.
Let’s take a look at three of the most popular Fear and Greed indices.
CNN
CNN’s equity Fear and Greed Index is the template. It looks at approximately seven factors across the stock market: Price trend vs moving average, the number of stocks making new highs vs lows, up vs down volume, put/call options, junk bond spreads, the VIX, and stocks vs Treasuries.
Each input is compared with its own historical range and mapped to a 0–100 score: behaviour associated with panic pushes it toward 0, risk-on behaviour toward 100. The final index is just the average of the seven metrics.
Alternative.me
Alternative.me is the crypto version that follows the same logic but uses crypto-specific inputs and is heavily Bitcoin-centric.
In simplified terms, it mixes:
- Volatility and drawdowns
- Price momentum and trading volume
- Social media activity
- Bitcoin dominance (BTC’s share of total crypto market cap)
- Google search interest for crypto terms
For each of those, it asks: ‘Is today’s reading unusually fearful or greedy compared with the last 30–90 days?’
Advertisement
Unusually high volatility and deep drawdowns push the score toward fear. Strong uptrends on high volume, lots of positive social buzz, falling BTC dominance (money rotating into alts), and surging search interest tend to push it toward greed. Each component is normalised to a 0–100 scale, then combined using fixed weights to get the final number.
CoinMarketCap Fear & Greed
CoinMarketCap’s Fear and Greed Index is simpler and more focused on price behaviour across the biggest cryptocurrencies (excluding stablecoins).
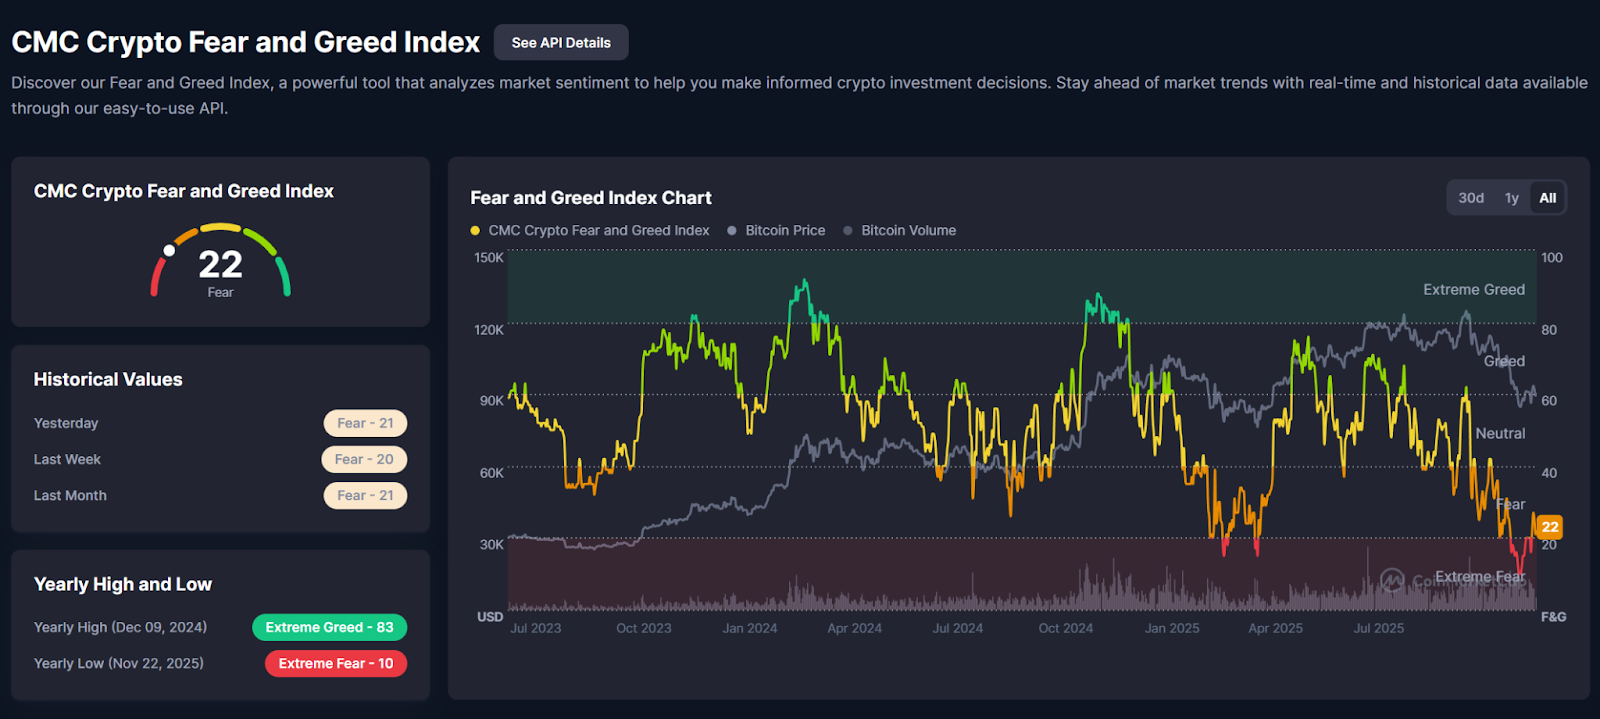
It looks at how the top coins are moving relative to each other and to the broader market, then converts that pattern into a 0–100 sentiment score: broad, strong rallies in majors tilt it toward greed; weak, choppy, or one-sided action tilts it toward fear.
The detailed formula is proprietary, but the core is ‘top-coin momentum and breadth mapped into a single sentiment number,’ updated in real time.
How accurate is the Fear and Greed Index?
One thing to always remember is that there’s no definitive answer/conclusion when using this index. The Fear and Greed Index is good at showing current sentiment – i.e., how people feel right now – but it is far from a silver bullet for timing crypto trades.
The bottom line is that it should be treated as a context tool and not a magical strategy by itself. So, there’s two kinds of ‘accuracy’ to consider here:
- Sentiment accuracy: whether ‘Extreme Fear’ lines up with panic and cheap prices, and ‘Extreme Greed’ with hype and froth.
- Predictive accuracy: whether those extremes usually lead to a clear, tradeable reversal with a good risk–reward.
Historically, the Fear and Greed Index can be used as part of a contrarian investment strategy (e.g., buying when fear is high, or selling when greed is high) with relative success. However, an Extreme Fear reading doesn’t necessarily mean the market will rebound, and vice versa.
Single indicators like the F&G Index should always be used in combination with other metrics and trading strategies as part of a broader investment plan.
In fact, a study performed by Code Meets Capital unveiled that a simple ‘buy and hold’ strategy outperformed actively selling during periods of extreme greed.
The FTX Collapse
When FTX failed in November 2022, Bitcoin was already dealing with the downward pressure of a saturated market and the Terra Luna aftermath (terrible times, we know). BTC was already trading down into the mid-US$15,000 (about AU$23,000–AU$24,000).
FTX was a capitulation spike for an already exhausted bear market – not the trigger that started it. That framing lines up cleanly with how the Crypto Fear and Greed Index behaved.
- Quick take: After a liquidity-fuelled peak in late 2021, Bitcoin spent most of 2022 in a structural downtrend. Aggressive rate hikes and tighter financial conditions killed the ‘everything up’ regime, while crypto-specific shocks like Terra/Luna’s collapse forced deleveraging across lenders (Remember Celsius Network?), funds and exchanges.
Through that period, the Fear and Greed Index obviously spent more time in ‘Fear’ than ‘Greed’, with occasional relief rallies.
- One of the lowest readings: When FTX blew up in November 2022, BTC briefly flushed into the mid-US$15,000s and major sentiment indices dropped into some of the lowest readings on record (around 12). The index sat in Extreme Fear for several weeks. That was the ‘ok, maybe crypto is really dead’ phase, with constant headlines about fraud, contagion, and missing customer funds (and a lot of layoffs).
So, What Happened Afterwards?
In the weeks and months after FTX, BTC mostly moved sideways around those lows, with no clean V-shaped bounce.
Over the next 6 months, it gradually reclaimed the US$20,000–US$30,000 band and ultimately broke to new all-time highs, making the FTX region, in hindsight, the macro bottom zone, as we can see in the image below:
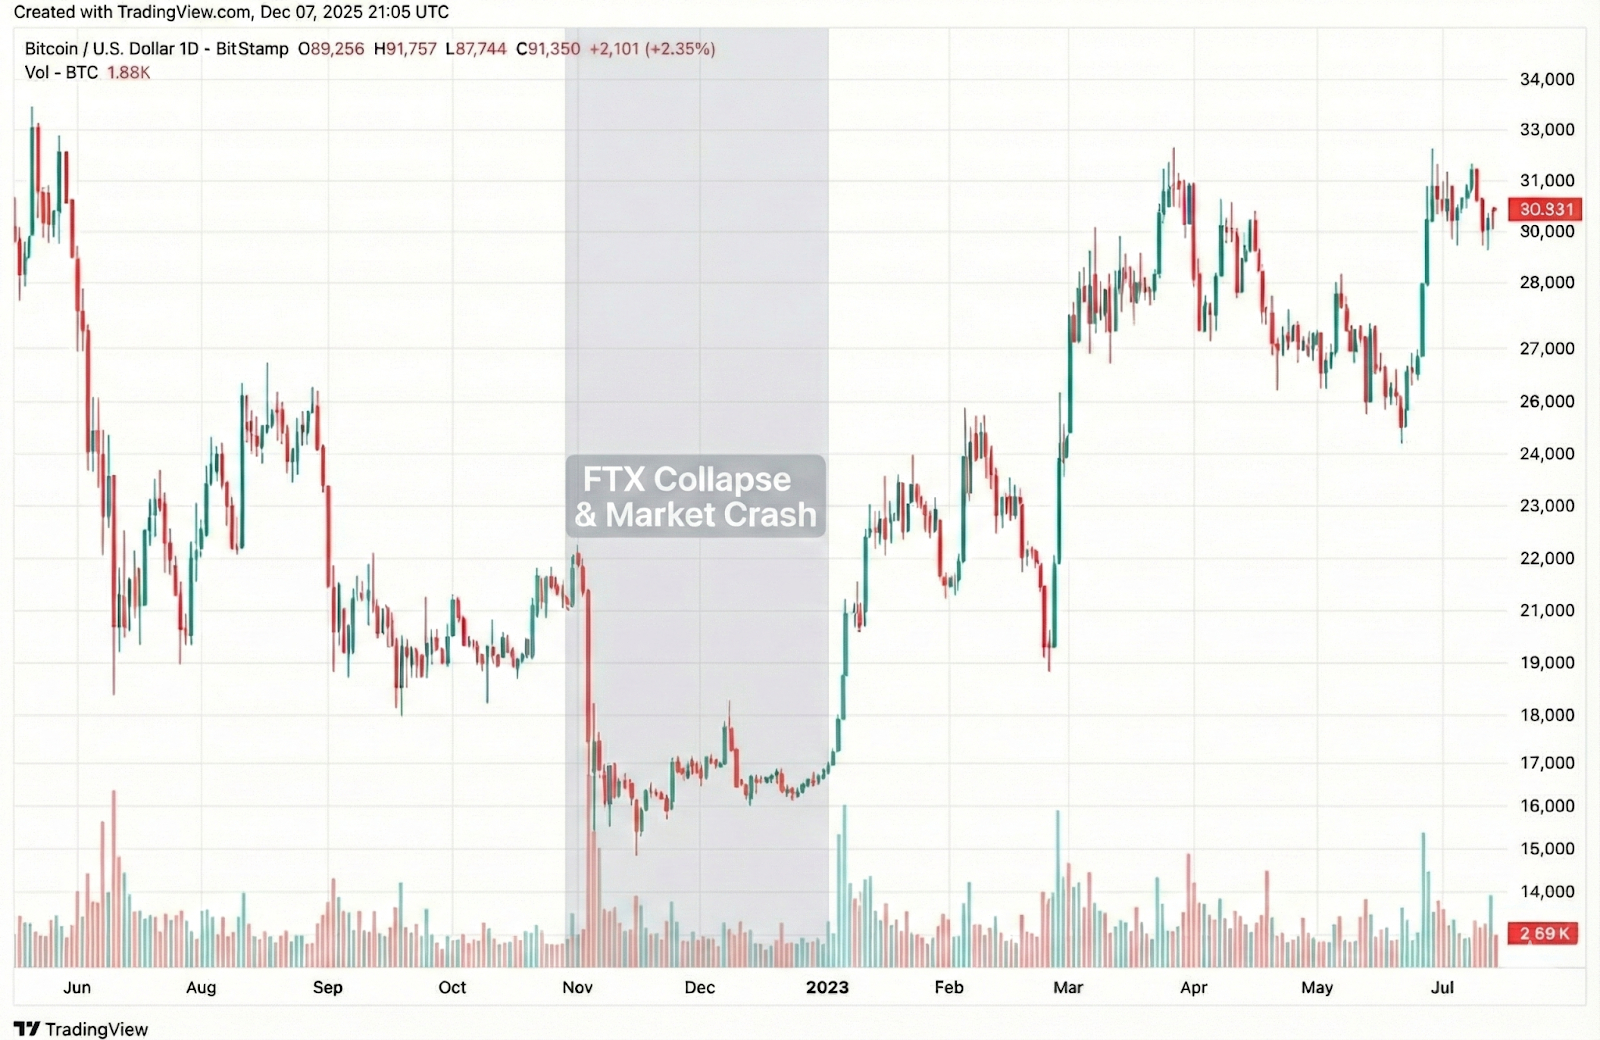
There we see the long, uneven recovery built on that base.
Again, not a conclusion, but the correlation you can draw is straightforward: the FTX collapse coincided with one of the deepest and most persistent Extreme Fear clusters in the index’s history and coincided with the price area that has so far marked the cycle low. Buying during or shortly after that period would have, on a multi-year horizon, delivered strong returns.
At the same time, the episode shows that extreme readings that precede reversals are mostly a rule of thumb. The index did not mark the cycle bottom, or floor, and it did not give an exact day to buy. It just highlighted a rare, capitulation-level environment, and that region, not a single print, ended up preceding a durable trend reversal.
You may like: How to Buy Crypto ETFs in Australia
Downsides of using Fear and Greed Index
Here’s the gist of it:
- It’s a lagging indicator, so it reacts to moves that already happened, not what’s about to happen.
- It oversimplifies because it compresses complex positioning and sentiment into a single number, losing nuance.
- What “Extreme Fear/Greed” means can change across cycles and regimes.
- There’s limited transparency, so exact formulas, thresholds, and data treatments are often proprietary.
- Easy to overuse. Many people treat it as a timing signal. Historically, it works better as context than a standalone trading rule.
Conclusion
Investors often treat these indices as contrarian signals. Extreme fear can suggest forced selling is mostly done and that prices may be closer to a bottom. Extreme greed can mean too much optimism and a higher risk of a pullback.
Still, they are only one tool. They work best when used alongside fundamentals, macro data, and other research rather than as a standalone trading signal. It should never inform an entire trading strategy.
A practical takeaway: use Fear and Greed as a risk and psychology gauge layered on top of your own view, trend/momentum tools, and macro/fundamental work, not as something to trade on in isolation.
This is not financial advice, only for educational purposes. You should always do your own research.
Author
José Oramas
José is a journalist and translator with a keen interest in blockchain and cryptocurrencies.