


Advertisement
Bitcoin Dominance

Bitcoin dominance (BTC.D) is a simple way to see where money in crypto is concentrating. It shows what percentage of the total crypto market value is held in Bitcoin. If Bitcoin makes up a large share of the market, dominance is high. If other cryptocurrencies grow faster than Bitcoin, dominance falls.
What to know:
Dominance won’t tell you which altcoins to buy, and it won’t time tops and bottoms. It helps you understand what phase the market is in to help inform your overall strategy. It can assist in identifying whether the market is rotating toward safety (rising BTC.D), or if the market is clearly rotating toward risk (falling BTC.D).
So… why do people use it? Well, people use Bitcoin dominance as a proxy for risk appetite. In short:
- When dominance rises, it usually means investors are choosing safety and liquidity. Bitcoin is seen as the most established and liquid asset in crypto, so capital tends to move there (and to stablecoins) during uncertainty.
- When dominance falls, it typically means money is spreading into altcoins, which are generally riskier and more speculative, but are considered to have higher growth potential.
The calculation itself is straightforward. Bitcoin Dominance (%) equals the total BTC market cap divided by the total crypto market cap, multiplied by 100.
You can do it yourself quite easily – you take Bitcoin’s market cap and divide it by the total crypto market cap, then multiply by 100. For example, if Bitcoin’s cap is worth $1.64 trillion USD and the total crypto market is worth $2.80 trillion USD, Bitcoin dominance is about 58.6%.
In general the exact number matters less than the direction it’s moving.
You may like: What is the Fear and Greed Index?
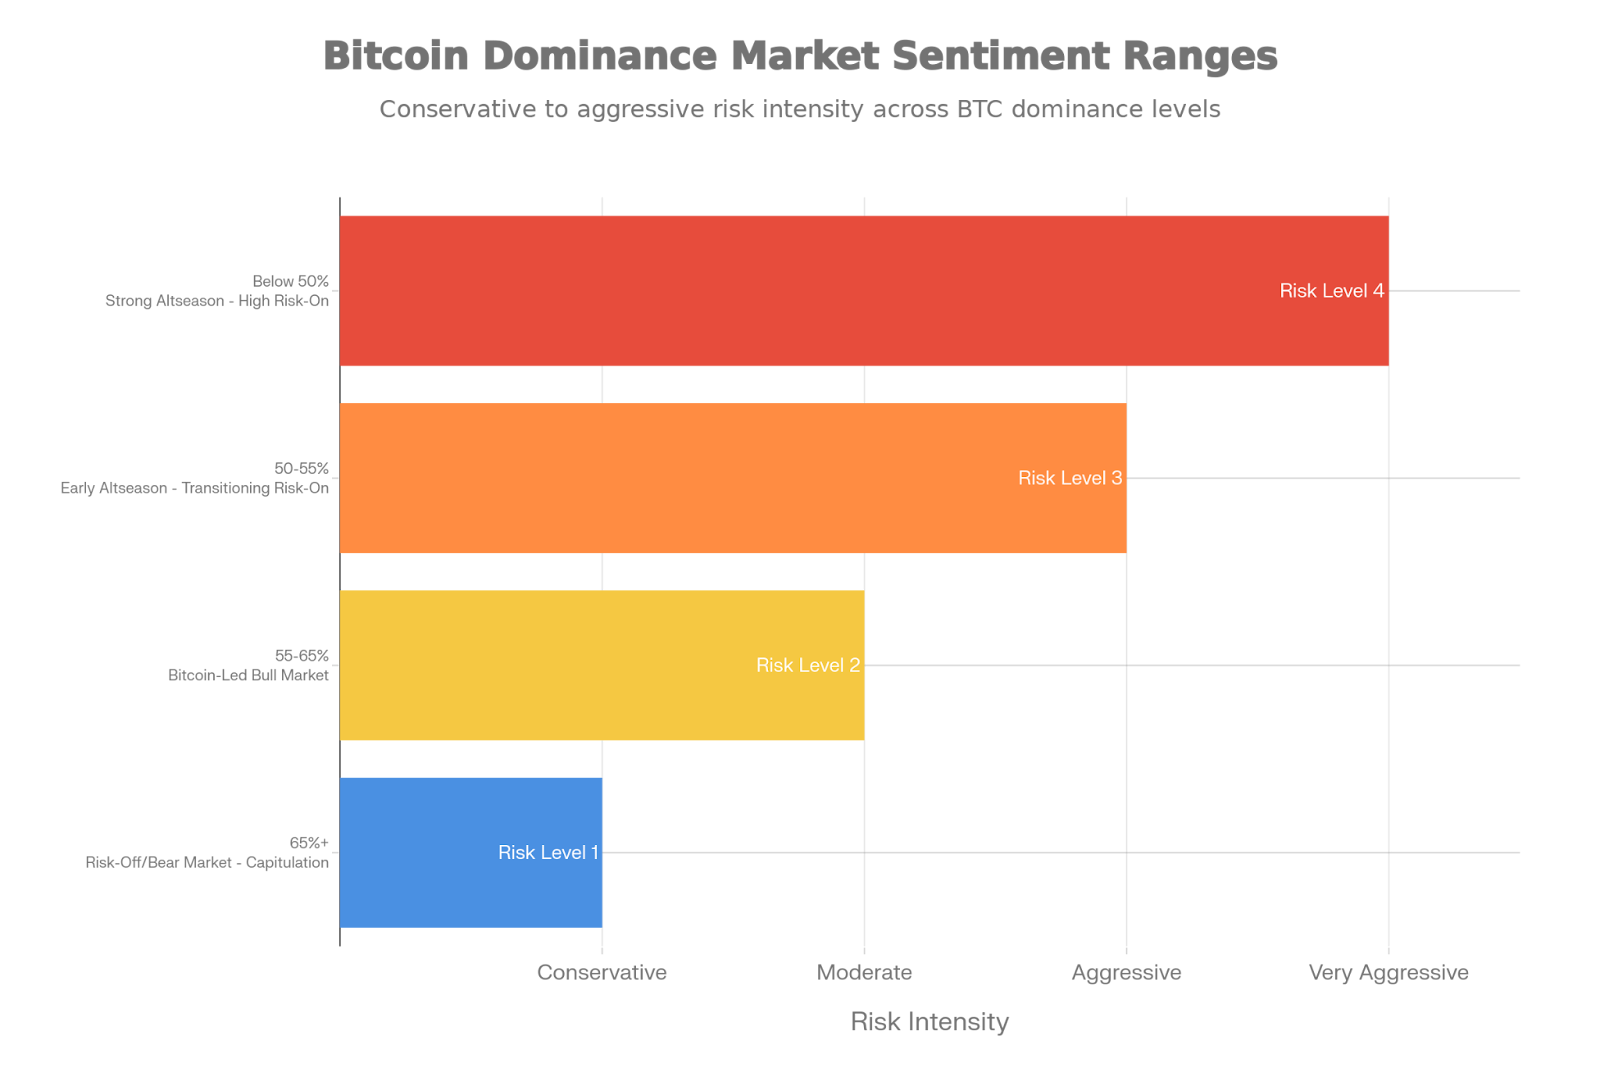
Bitcoin Dominance Ranges And Market Sentiment
Reading Bitcoin dominance is mainly about understanding market phases. When dominance is high, usually above the 60% mark, the market is defensive. Altcoins tend to underperform, and capital is either parked in Bitcoin or leaving crypto altogether. This often happens during bear markets or sharp corrections, even if Bitcoin’s price is falling as well.
When dominance sits in the mid-50% range, Bitcoin is usually leading the market. New capital enters through Bitcoin first, while altcoins lag behind. This is common in early bull markets, where confidence is returning but risk appetite is still limited.
Moreover, as dominance moves lower, toward the low-50% range, capital is often rotating into large altcoins like Ethereum (ETH), XRP, or Solana (SOL). This is a transition phase where Bitcoin holders take profits and reallocate into higher-risk assets.
Below 50%, the market is typically in full “alt season,” where smaller-cap tokens, DeFi, NFTs, and new narratives often outperform Bitcoin. Risk appetite is high, and speculation is widespread.
Advertisement
Market Cycle Phases And What To Know
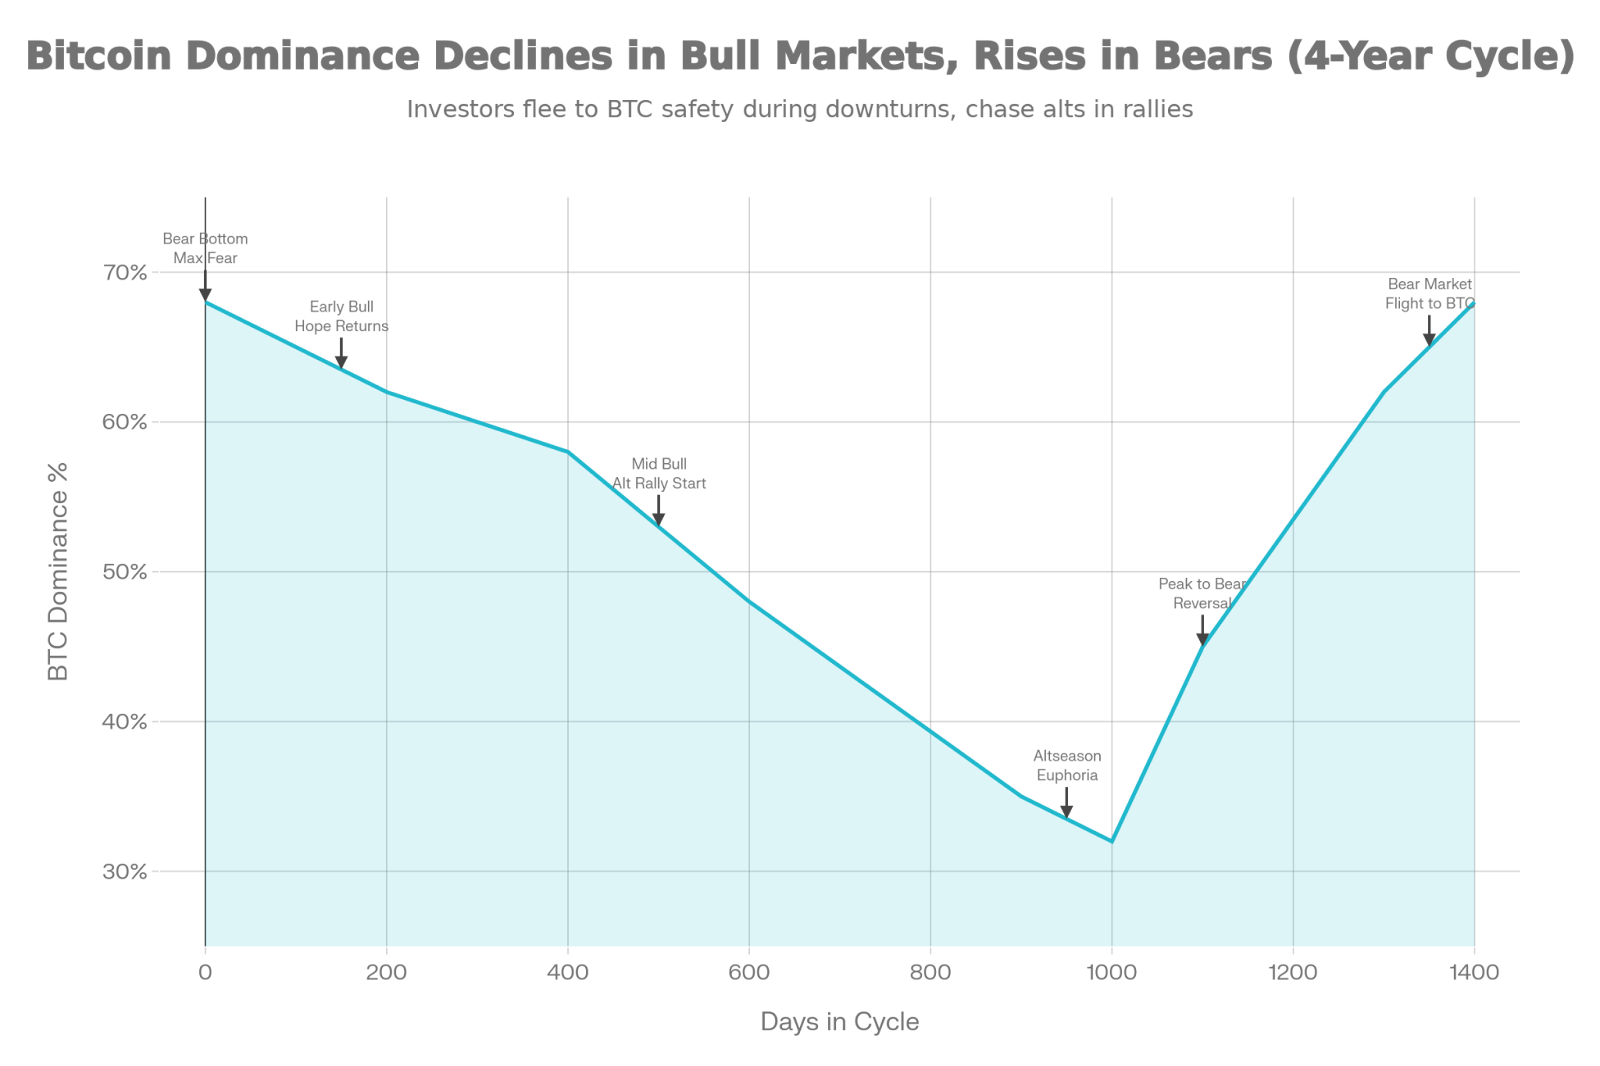
Bitcoin dominance tends to follow predictable patterns throughout cryptocurrency market cycles.
Bitcoin dominance moves in cycles that often align with broader crypto market phases. Expanding these phases helps explain why capital behaves the way it does and what each phase usually feels like in practice.
However, keep in mind these phases are based on historical data, and past performance is not a reliable indicator of future performance. These cycles are good to keep in mind, but should never be taken as the singular truth.
With that in mind, let’s break it down.
Bear market bottom and capitulation
This phase follows extended drawdowns and usually coincides with exhaustion:
This is where Bitcoin dominance is typically elevated because altcoins have already been heavily sold and liquidity has concentrated in Bitcoin or exited the market entirely. It often goes like this:
- Trading volumes are low and sentiment is pessimistic.
- Narratives are focussed on survival rather than growth.
- Price action is usually choppy and unconvincing, with frequent false starts or traps.
- In this particular environment a good chunk of speculative activity disappears, and the market is driven by longer-term participants accumulating slowly.
Early recovery and accumulation phase
As selling pressure fades, Bitcoin begins to stabilise and then trend upward. Dominance often remains high or increases slightly because new capital entering the market tends to choose Bitcoin first.
Confidence is rebuilding, but risk appetite is still limited. Altcoins usually lag, showing weak relative performance and little sustained momentum. This phase is defined by accumulation rather than excitement: steady buying, improving liquidity, and gradual increases in on-chain and market data without broad public attention.
Bitcoin-led expansion
Once the recovery is established, Bitcoin often becomes the clear market leader. Price advances are stronger, media attention returns, and institutional and macro narratives re-emerge.
Dominance stays elevated because capital continues to flow into Bitcoin as the default entry point. Altcoins may rise in absolute terms, but they underperform Bitcoin on a relative basis. This phase often feels “obvious” in hindsight but uncertain in real time, as many participants wait for confirmation that the market has truly turned.
Capital rotation into major altcoins
Some holders begin reallocating profits into large, liquid altcoins, most commonly Ethereum and other high-cap networks when they notice Bitcoin’s rally is maturing. The sentiment among investors may be that they’ve “missed” the BTC push, and there are greater potential returns among other digital assets.
Therefore, Bitcoin dominance starts to gradually decline and market behaviour shifts from cautious optimism to selective risk-taking. This typically coincides with liquidity spreading across ecosystems, narratives broadening, and activity increases in DeFi, infrastructure, and L2s.
This phase tends to reward quality and scale rather than pure speculation.
Broad alt season and speculative expansion
This is the most aggressive risk-on phase of the cycle. Bitcoin dominance falls more sharply as capital moves beyond large caps into mid- and small-cap altcoins, new sectors, and emerging narratives. Performance dispersion increases, with some assets dramatically outperforming while others stagnate.
Similarly, we usually see a spike in leverage and short-term trading activity rise, and sentiment shifts toward optimism and fear of missing out (FOMO). This phase produces the largest gains but also sets up fragility, as prices become increasingly sensitive to shifts in liquidity.
Distribution and late-cycle instability
Late in the cycle, market conditions appear strong on the surface, but internal signals begin to weaken:
- Bitcoin dominance may stop falling and start to rise, even as many altcoins continue to post gains. This reflects quiet rotation back toward Bitcoin or stablecoins by larger participants.Volatility increases, reversals become sharper, and correlations across altcoins rise.
- Volatility increases, reversals become sharper, and correlations across altcoins rise.
- Confidence remains high publicly, but risk tolerance among experienced participants starts to decline.
Market reversal and transition back to bearish conditions
When the cycle turns, altcoins usually fall faster than Bitcoin. Bitcoin dominance rises quickly as liquidity exits speculative positions and seeks relative safety. Market narratives shift from growth to risk management. Volume spikes during sell-offs, followed by long periods of reduced activity. This transition completes the cycle and resets conditions for the next accumulation phase.
In summary, a practical way to spot alt season-style conditions is to look for a clear downtrend in dominance and then watch where the money goes. This rotation often moves in a sequence:
- Bitcoin strength first, then large-cap alts, then mid-caps, then smaller caps and narrative-driven tokens.
- The early, more conservative “alt season opportunity” is usually when dominance breaks down from a Bitcoin-led range and large caps start outperforming in a steady way.
- The late, high-risk opportunity is when dominance is already low and smaller caps are moving aggressively. That phase can be profitable but is also where reversals hit hardest.
Risk Management: Risk On And Risk Off
BTC.D is helpful for risk management because it flags whether the market is moving toward liquidity concentration or liquidity dispersion. You can use it to adjust exposure and leverage gradually, and to tighten rules when the trend goes against your positioning.
Here are some risk controls that users may leverage as part of a broader trading strategy:
- Position sizing: Smaller alt positions when BTC.D is rising, larger alt positions only when BTC.D is falling and breadth of liquidity improves.
- Liquidity bias: Stick to higher-liquidity alts when dominance is elevated, expand to smaller caps only in established risk-on phases.
- Stops and invalidation: Tighter stops on alts during rising dominance, wider tolerance only when dominance is declining in a stable trend.
- Leverage: Reduce leverage when dominance rises and volatility increases, keep leverage lowest in transition periods when dominance flips direction.
- Rotation discipline: Rotate in stages (BTC to large caps, then broader alts) instead of jumping directly into the most speculative assets.
- Frequent reviews: Traders usually reassess weekly – dominance is most useful on slower timeframes and can whipsaw on short charts.
Closing Thoughts
Taken together, these phases explain why Bitcoin dominance is useful as a macro tool. It helps identify whether the market is concentrating on safety, expanding selectively, or pushing into broad speculation.
While no cycle repeats perfectly, dominance patterns provide a structured way to understand where capital is moving and how risk appetite is changing over time.
Author
José Oramas
José is a journalist and translator with a keen interest in blockchain and cryptocurrencies.