Advertisement
Sandbox Breakout Analysis – Parabolic Breakout on SAND with +115% Gains in a Single Day

The Sandbox SAND just pumped up to +115% in a single day with a strong breakout on Binance & other Exchanges. Let’s take a quick look at the SAND price analysis and possible reasons for the recent breakout.
What is Sandbox?
The Sandbox claims to be a virtual world where players can build, own, and monetize their gaming experiences in the Ethereum blockchain using SAND, the platform’s utility token. It is claimed that players can create digital assets (Non-Fungible Tokens, aka NFTs), upload them to the marketplace, and drag-and-drop them to create game experiences with The Sandbox Game Maker. It is further claimed that The Sandbox has secured over 50 partnerships including Atari, Crypto Kitties, and Shaun the Sheep to build a fun, creative “play-to-earn” Gaming platform, owned and made by players. The Sandbox aims to bring blockchain into mainstream gaming, attracting both crypto and non-crypto game enthusiasts by offering the advantages of true-ownership, digital scarcity, monetization capabilities, and interoperability.
SAND Quick Stats
| SYMBOL: | SAND |
| Global rank: | 252 |
| Market cap: | $106,223,142 AUD |
| Current price: | $0.1364 AUD |
| All time high price: | $0.1902 AUD |
| 1 day: | +115.84% |
| 7 day: | +163.12% |
| 1 year: | +184.27% |
SAND Price Analysis
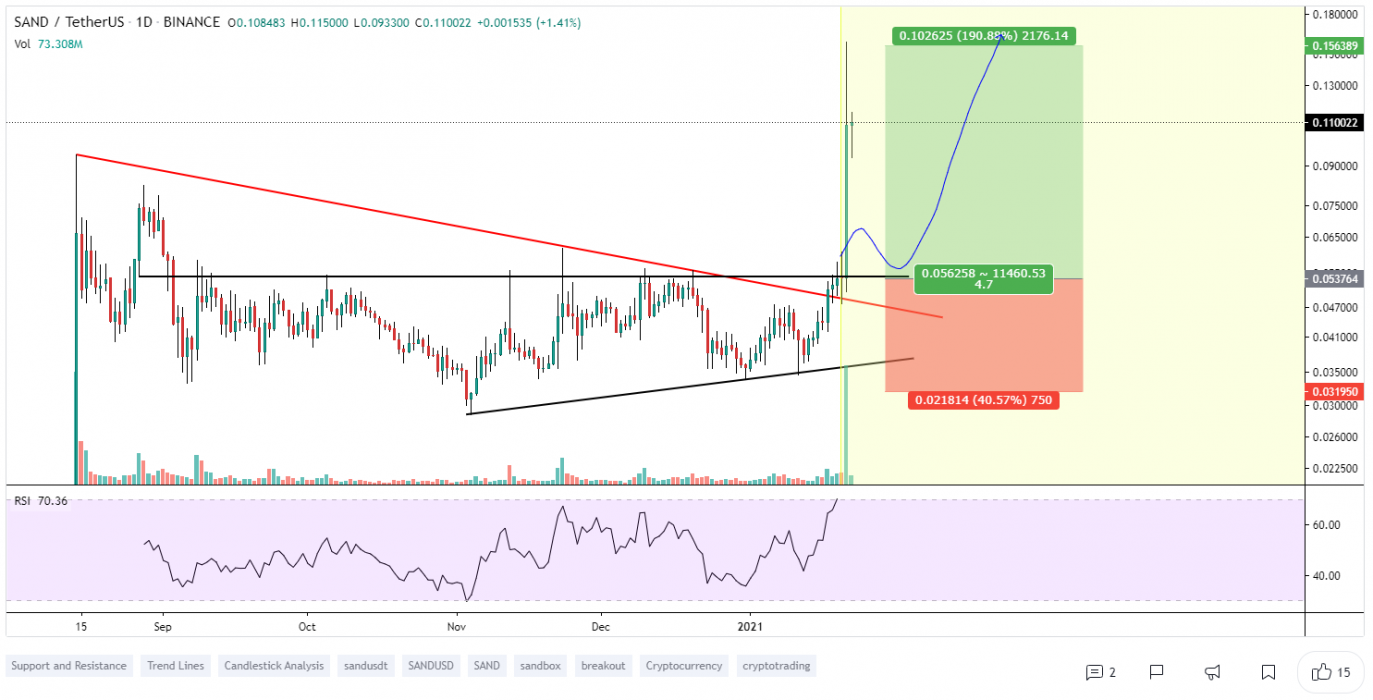
At the time of writing, SAND is ranked 252nd cryptocurrency globally and the current price is $0.1364 AUD. This is a +163.12% increase since 16th January 2021 (7 days ago) as shown in the chart below.
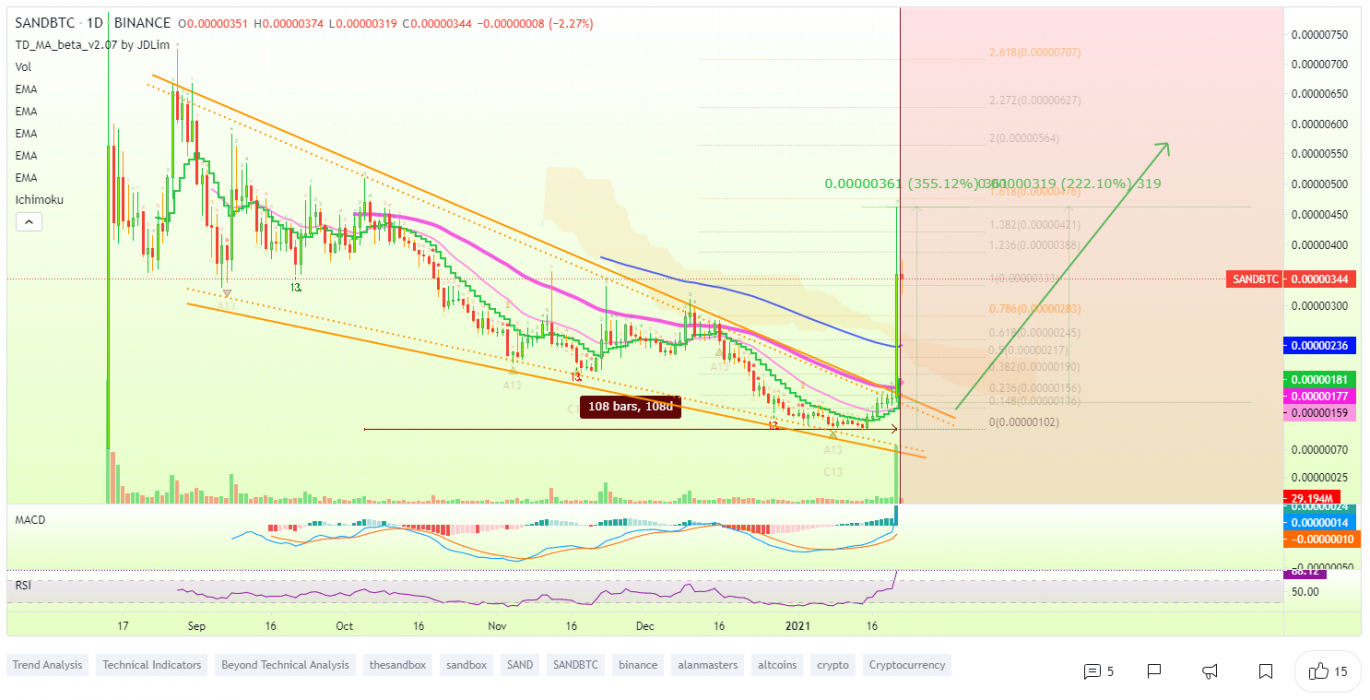
If we see the above 1-day candle chart, SAND did a strong parabolic breakout from the falling wedge pattern while trading sideways from the last few days around $0.0624 AUD price levels & is now heading towards its previous major resistance which is $0.1578 AUD. After BTC made a slight correction in its price this week and few Altcoins are also following this downtrend but, SAND looks well-positioned to hit the next high price levels with strong buying volume.
“The Falling Wedge is a bullish pattern that begins wide at the top and contracts as prices move lower. This price action forms a cone that slopes down as the reaction highs and reaction lows converge.”
What do the technical indicators say?
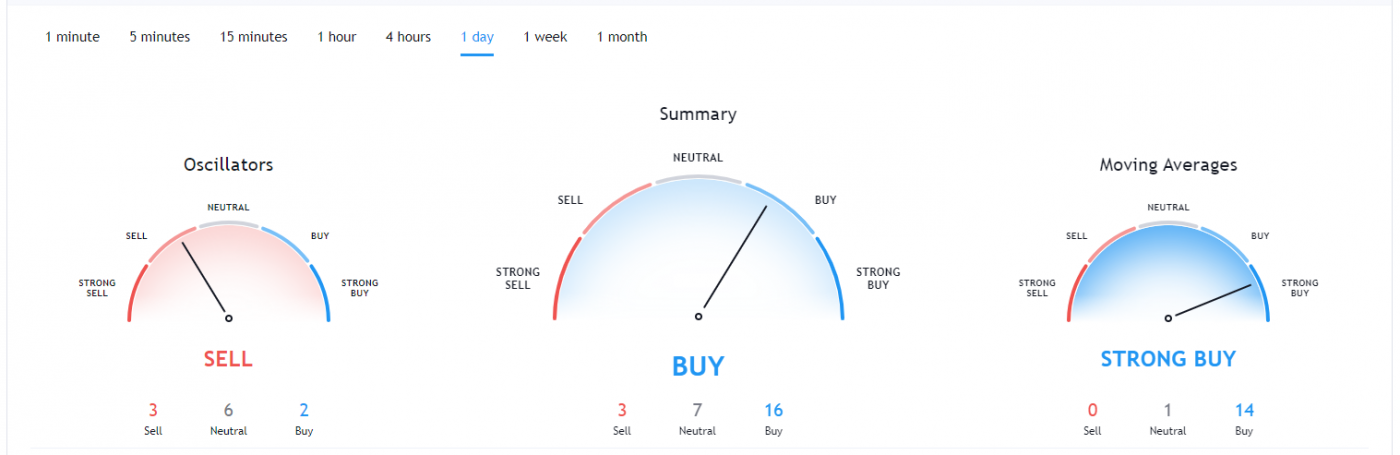
The Sandbox TradingView indicators (on the 1 day) mainly indicate SAND as a buy, except the Oscillators which indicate SAND as a sell.
So Why did SAND Breakout?
The recent rise in Bitcoin over +300% since the halving in May and then the suggested start of the Altcoin season could have contributed to the recent breakout. Another reason for this sudden pump in price could be the whales secretly buying SAND for the next Altcoins rally & it could also be contributed to some of the recent news of the 2021 Ambassador Program.
Recent SAND News & Events:
- 25 November 2020 – Multiplayer Features
- 28 December 2020 – Public LAND Sale
- 31 December 2020 – VoxEdit Official Release
Where to Buy or Trade SAND?
The Sandbox SAND has the highest liquidity on Binance Exchange so that would help for trading SAND/USDT, SAND/BTC, or SAND/ETH pairs. However, if you’re just looking at buying some quick and hodling then Swyftx Exchange is a popular choice in Australia.
Author
Malik Junaid
Malik is a skilled writer with a background in Software Engineering. His interests are blockchain, cryptocurrency trading and market analysis.