


Advertisement
On the Radar – Coins to Watch 18/04

- Bitcoin halving is days away. How will the markets react in the coming days?
- Looking at the big picture, and why I think we are just getting started.
- Altcoin Analysis – ETH, SOL.
Another week passes without us seeing crypto markets move to show any serious signs of resuming the uptrend we’ve all been accustomed to so far this year. But it’s not all doom and gloom. We do have the biggest fundamental catalyst happening this weekend – the Bitcoin halving!
Personally, I don’t think anyone has a crystal ball on where prices are going in the next few days or weeks after the halving. But in my eyes, the likely scenario is we may see prices run in both directions, inflicting pain on both bulls and bears before the next trend shows its hand.
Early days
The graphic below represents Bitcoin’s price performance from the bottom of each market cycle. A key takeaway is that price performance has reduced each cycle. It also provides a clear example that, even historically speaking, anything is possible.
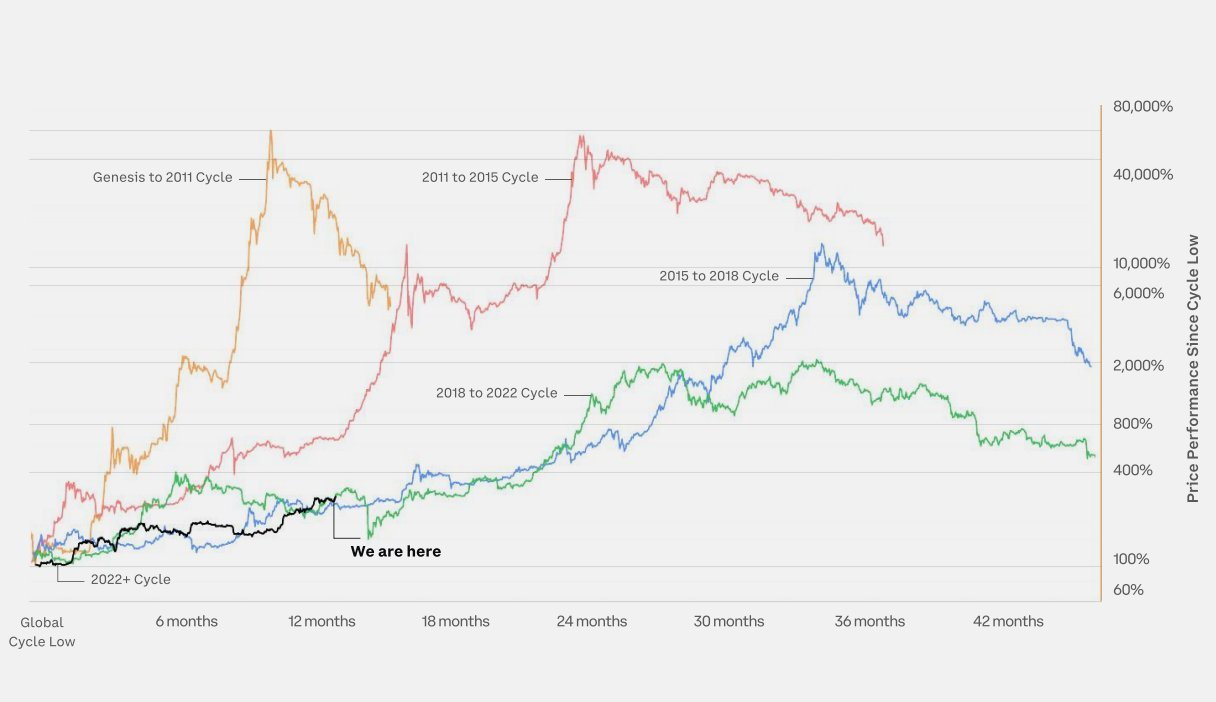
During the 2018 to 2022 cycle (green line), we can see a very violent correction occurred relative to where we are today in this 2022+ cycle (black). However, prices were also performing much better at the six-month mark compared to this cycle.
Alternatively, the 2015 to 2018 cycle (blue line) shows us that the market took off from this point in time and never looked back. You could argue that the 2022+ cycle to date has closely followed the 2015 to 2018 cycle, which is much closer than others.
If you have a time machine, do us all a solid and let us know how it played out before we get there!
That all being said, categorically we can see that the trend has been for higher prices in the long run – despite the unpredictability of short-term price moves from where we stand today.
Related: Bitcoin Miners Are Overvalued Warns Analyst, Stocks Could Plummet Further
Bitcoin – BTC
Looking at some very simple range analysis using last week’s high and low, below are my thoughts heading into the end of the week.
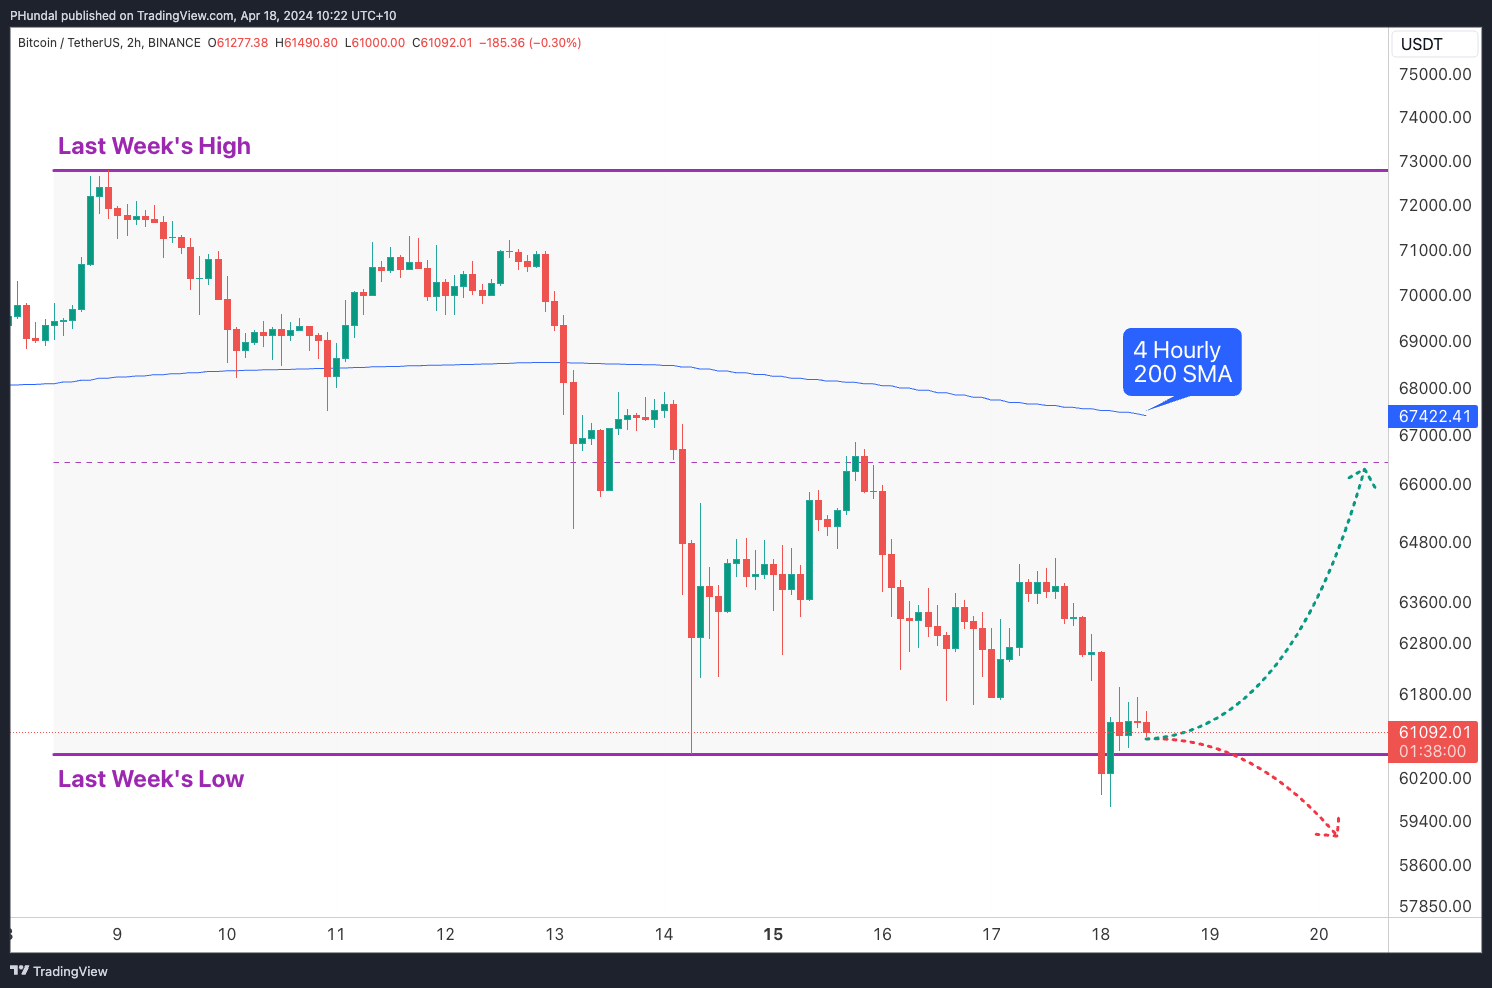
Bitcoin has overnight briefly traded below the previous week’s low, before returning back above this level. From here there are two scenarios to watch for.
Bullish scenario
Bitcoin holding above this previous week’s low from here would be a win for the bulls. The midpoint of last week of $66,500 USD would be my next area of interest.
The 200-period 4-hourly simple moving average (blue line) would also likely be at this level in the coming days.
Bearish scenario
Failure to hold above the previous week’s low, precipitates another breakdown. This is how we could build the case to see prices under $60,000 USD.
Ethereum – ETH
Let’s take a look at how ETH is playing out technically, and map out some potential scenarios based on what Bitcoin could do next.
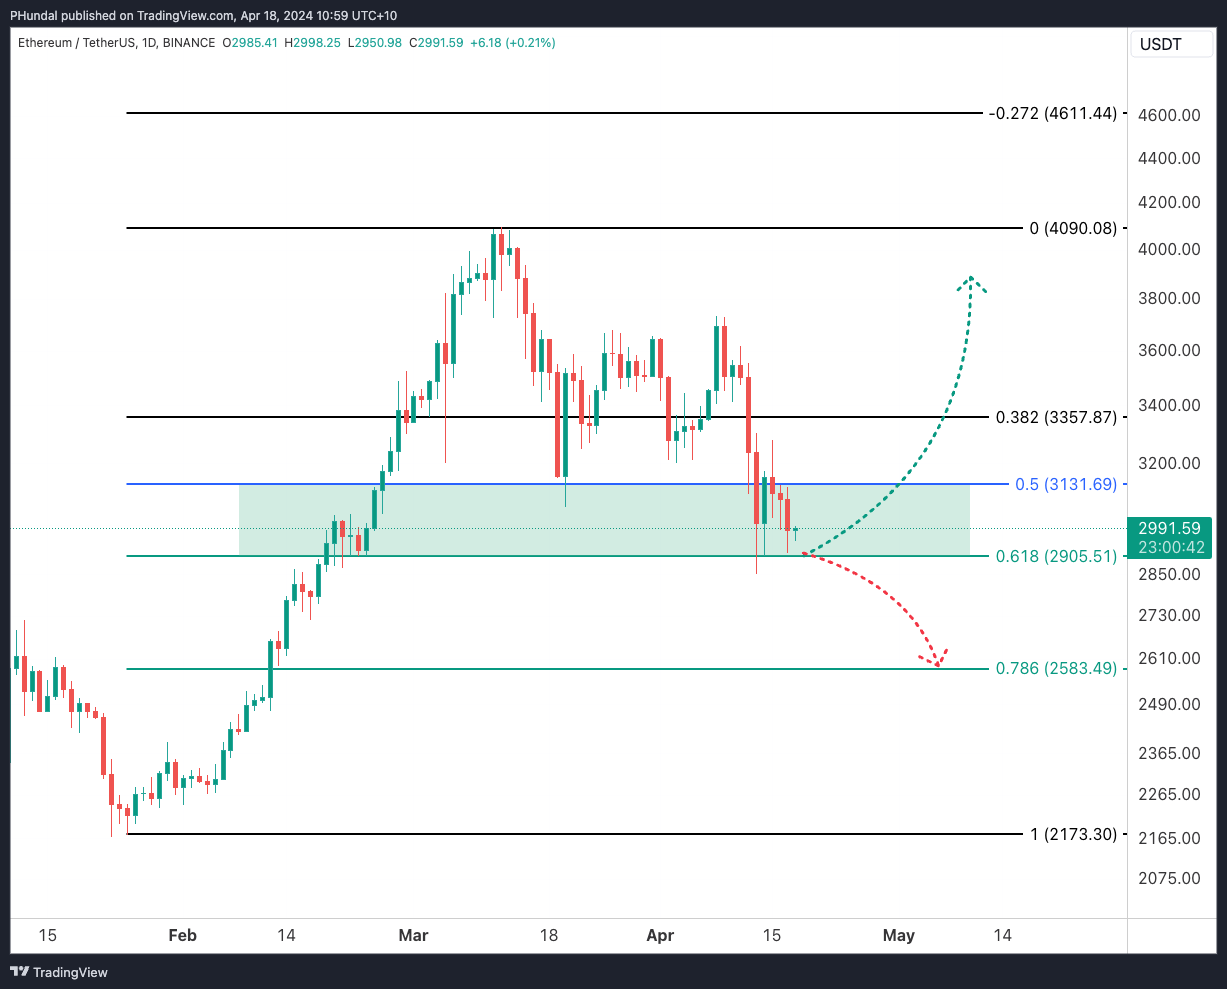
Using a Fibonacci Retracement tool, we can measure from the most recent swing low to high. A key sign of strength when using Fibonacci is getting above the 0.618 ratio and seeing the market push higher. I’ve identified this as the green-boxed zone above.
Bullish scenario
If Ethereum market participants can hold the price at these levels, it could provide the foundations for a push higher towards the previous highs.
Bearish scenario
Failure for buyers to see value at these levels, could result in a move lower. The next key Fibonacci level is the 0.786 ($2,583 USD).
Related: Bulls or Bears: Analysts Weigh in on Who’s Going to Dominate the Market
Solana – SOL
SOL is also setting itself up in a similar manner to ETH. I would suspect that the outcome will be the same on both assets, however one may move sooner than the other.
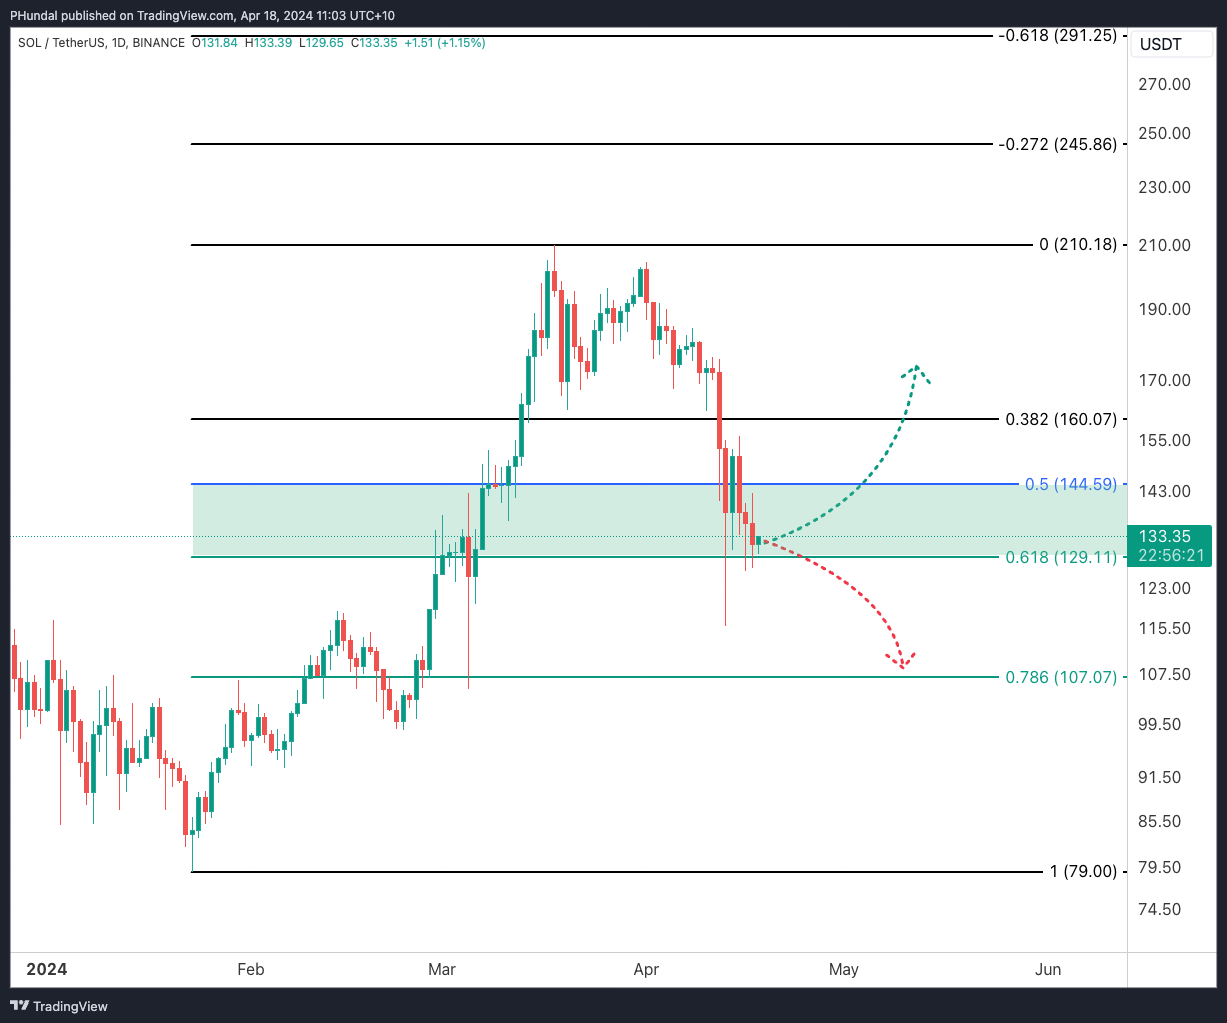
Using the Fibonacci Retracement tool, as explained above for ETH, below are two potential scenarios.
Bullish scenario
Market participants retain Solana’s price above $129.11 (the 0.618 fib ratio), which could then see a mark move higher towards previous highs. This would again set up the base for the next move higher for the bulls.
Bearish scenario
Failure to see any interest from the bulls at these levels, could result in the market moving towards the next key Fibonacci ratio of 0.786 ($107.07) to see if we get any involvement.
See you all again next week.
Keep up to date.
Stay informed and connected! I’m excited to announce my new YouTube channel, Crypto with Pav, where I dive into the latest trends in cryptocurrency, offering insights on what’s coming next and highlighting news and technical structure I believe is crucial.
I’m also on X.
Cheers!
Author
Pav Hundal
Pav Hundal, is a trader at heart. Making the transition from the FX markets to the dynamic world of cryptocurrency in 2017. With a keen eye for both technical and fundamental analysis, Pav places special emphasis on tracking macroeconomic conditions to build narratives around current trends. Currently, he lends his expertise as the Lead Market Analyst at Swyftx.


