


Advertisement
Horizen ZEN Breakout Analysis – ZEN Pumps +139% in a Week with Strong Bullish Trend

Horizen ZEN is flipping on a 1-day candle chart, ZEN has grown by a massive 139% in the past week. Let’s take a quick look at ZEN, price analysis, and possible reasons for the recent breakout.
What is Horizen?
Horizen is an inclusive ecosystem where everyone is empowered and rewarded for their contributions. Horizen’s massively scalable platform enables businesses and developers to quickly and affordably create their own public or private blockchains on the largest node network in the industry. Horizen’s Sidechain SDK provides all necessary components for easy and fast deployment of a fully customizable blockchain.
Horizen Quick Stats
| SYMBOL: | ZEN |
| Global rank: | 85 |
| Market cap: | $199,323,485 AUD |
| Current price: | $18.95 AUD |
| All time high price: | $91.50 AUD |
| 1 day: | +10.4% |
| 7 day: | +139.55% |
| 1 year: | +203.74% |
Horizen Price Analysis
At the time of writing, ZEN is ranked 85th cryptocurrency globally and the current price is $18.95 AUD. This is a +139% increase since 19 November 2020 (7 days ago) as shown in the chart below.
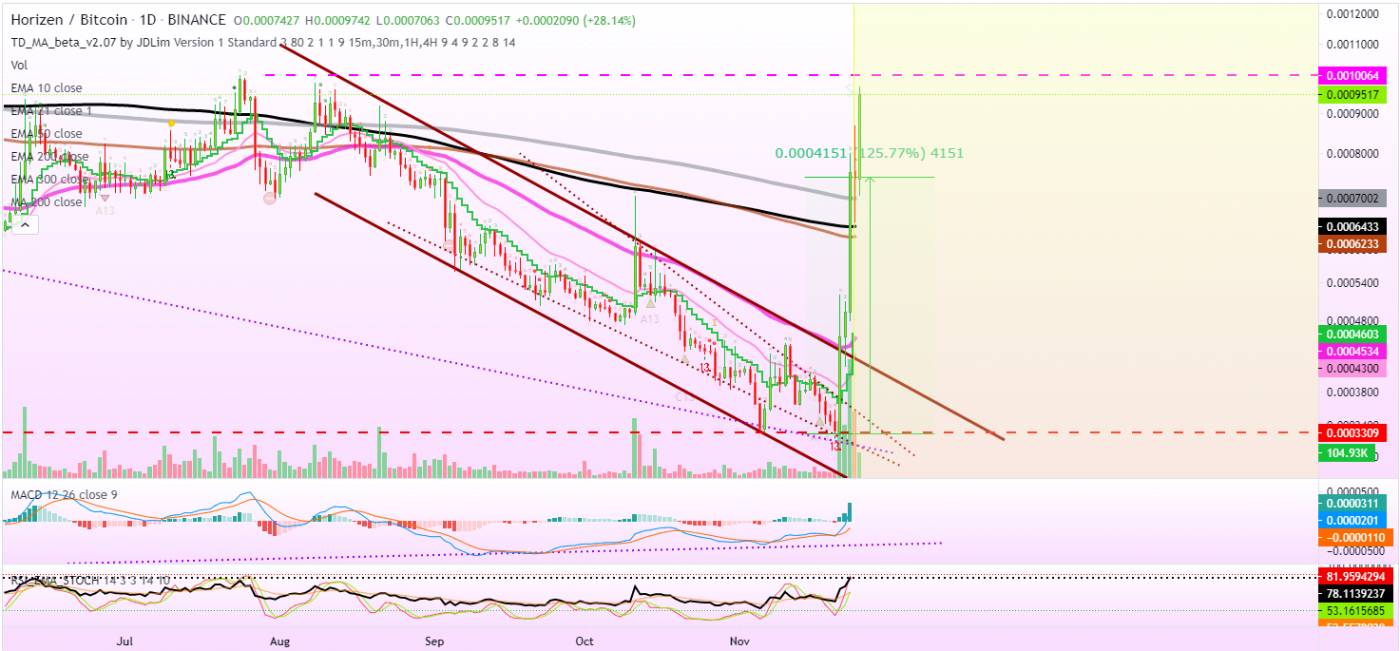
In the past week, there was a strong rise in Bitcoin, Ethereum, and Ripple. As a result, Horizen ZEN also formed strong support near $6.56 before starting a fresh increase against the AUD.
Here we also have the “W” pattern with a higher low just as looking at it before starting a strong increase, there was a break above a crucial contracting triangle with resistance near $11.65 on the daily chart of the ZEN/AUD. The pair gained pace above the $14.12 and $15.70 resistance levels.
“W pattern is a price pattern, also called Double Bottom. This pattern, when drawn it looks like the W and this is why it is called as W pattern. Sometimes patterns look like W but it is not the exact W pattern and these patterns are called Semi-W patterns.”
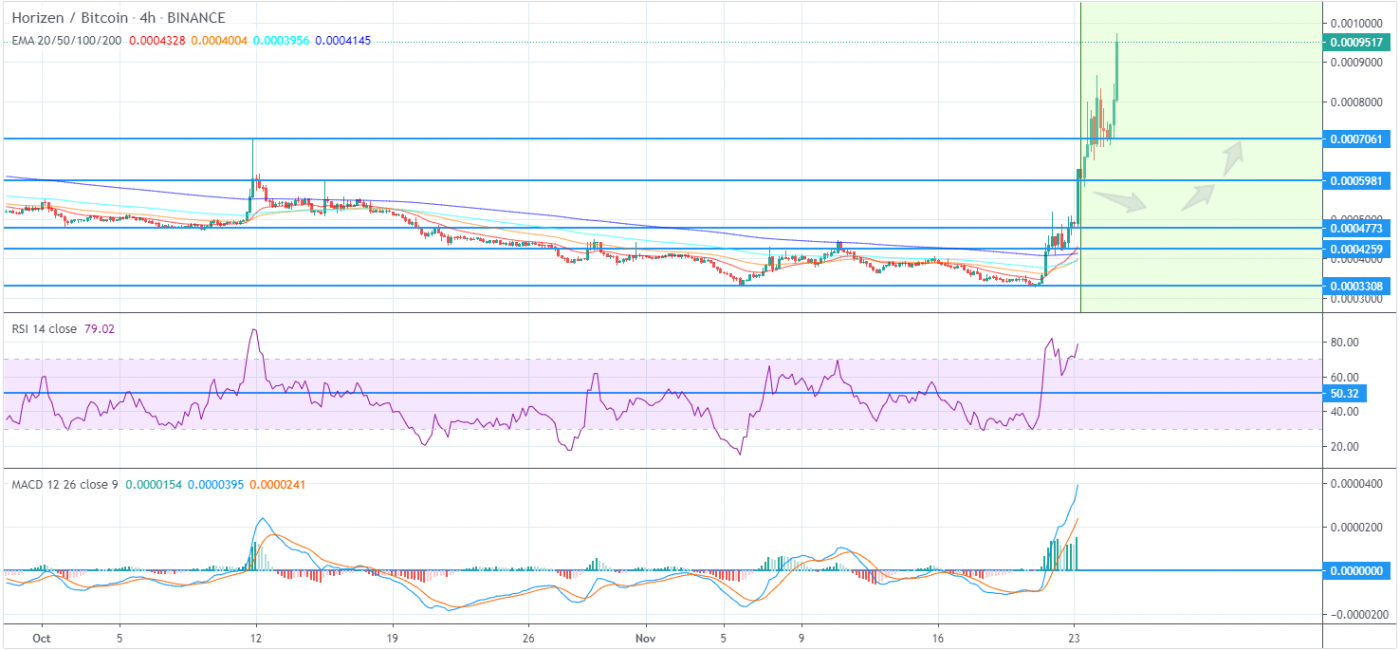
The price of ZEN gained pace by breaking above the 3rd major resistance of $15.12 AUD. If we see the above chart of ZEN/BTC pair on a 4-hour candle, it clearly shows the uptrend of Horizen ZEN has been started by joining the altcoins rally of 2020.
What do the technical indicators say?
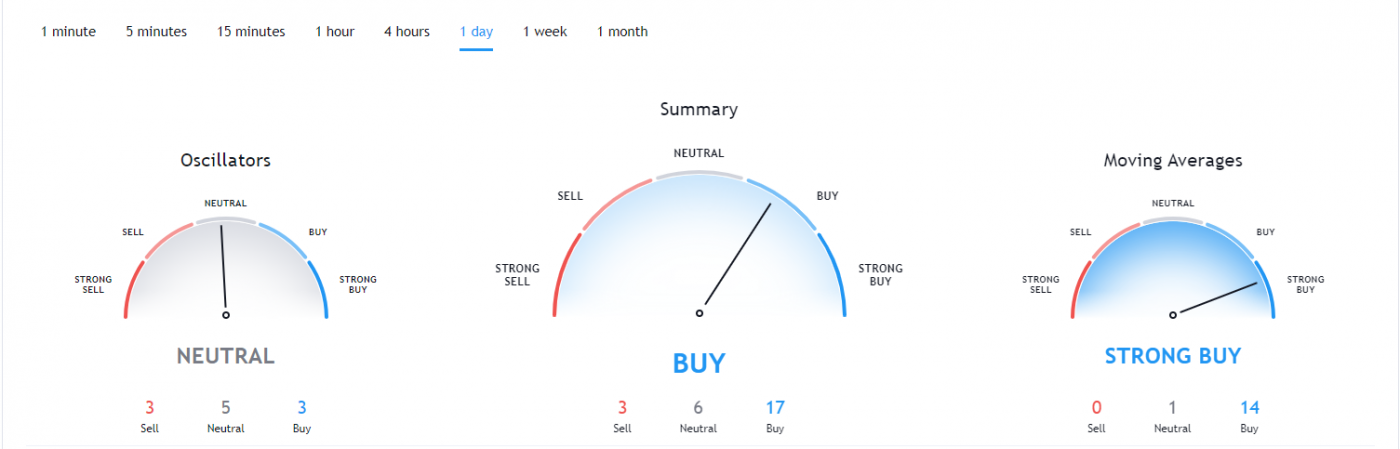
The Horizen ZEN TradingView indicators (on the 1 day) mainly indicate ZEN as a buy, except the Oscillators which indicate ZEN as a neutral.
So Why did ZEN Breakout?
The recent rise in Bitcoin over 100% since the halving in May and then the suggested start of the Altcoin season could have contributed to the recent breakout. It could also be contributed to some of the recent events where the Horizen ZEN 2.0.22 Mainnet Fork is happening today expected around Nov 25 – Block 835968.
Recent Horizen News & Events:
- 16 November 2020 – Weekly Insider #66
- 18 November 2020 – ZEN 2.0.21 Deprecation
- 23 November 2020 – Weekly Insider #67
- 25 November 2020 – ZEN 2.0.22 Mainnet Fork
- 29 November 2020 – Halving
- 30 November 2020 – Weekly Insider #68
Where to Buy or Trade Horizen?
ZEN has the highest liquidity on Binance Exchange so that would help for trading ZEN/USDT or ZEN/BTC pairs. However, if you’re just looking at buying some quick and hodling then Swyftx Exchange is a popular choice in Australia.
Author


